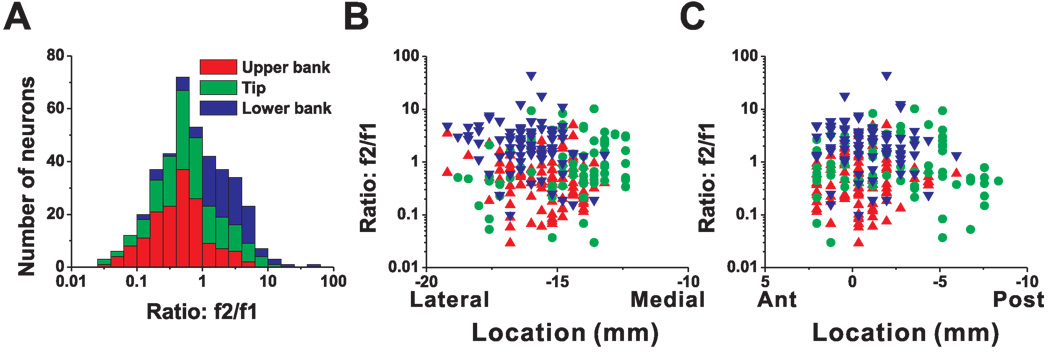
Figure 3.
Relationship between the f2/f1 ratio (second/first harmonic of response modulation along the preferred direction of translation) and cell location within the lateral sulcus. (A) Distribution of f2/f1 ratio (n=420), plotted separately for cells recorded in the upper bank (red, n=153), tip (green, n=150), and lower bank (blue, n=117) of the lateral sulcus. (B), (C) Scatter plots of the f2/f1 ratio as a function of medial-lateral and anterior-posterior stereotaxic coordinates. Only cells from the left hemisphere of monkey U (n=273) are shown. Results were qualitatively consistent for monkey J, but not included here because sinusoidal responses were not saved for off-line analysis in many experiments (see Methods). Data are color-coded according to their location within the upper bank (red triangles), tip (green circles), and lower bank (blue triangles).

