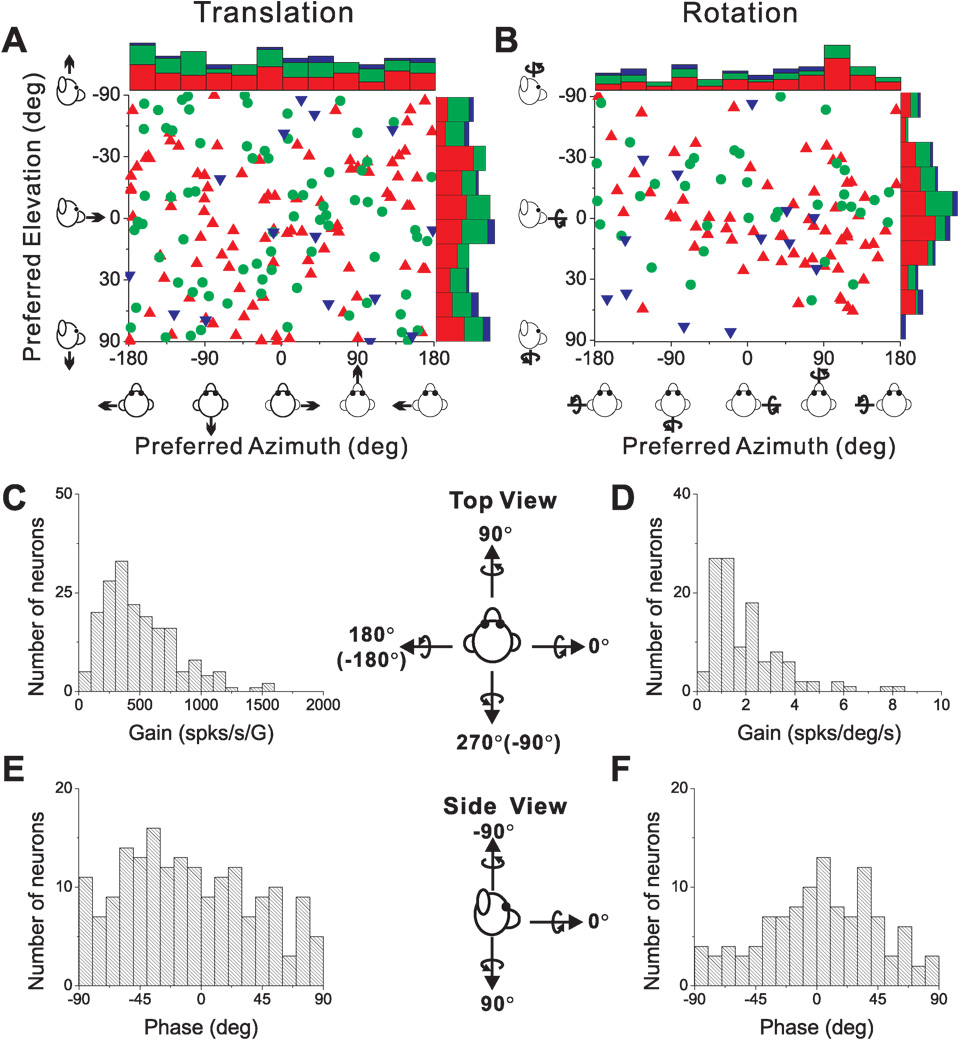
Figure 4.
Summary of sinusoidal responses. (A), (B) Distributions of direction preferences for translation (n=185) and rotation (n=114), in spherical coordinates (scatter plots of elevation versus azimuth preferences). Uniform azimuth and elevation distributions reflect direction preferences that are uniformly distributed on a sphere. The data are plotted on Cartesian axes that represent the Lambert cylindrical equal-area projection of the spherical stimulus space. Histograms along the top and right sides of each scatter plot show the marginal distributions. Data are color-coded based on the location of cells in the upper bank (red), tip (green), and lower bank (blue) of the lateral sulcus. (C), (D) Distributions of neural response gain along the 3D preferred direction for translation and rotation, respectively. (E), (F) Distributions of neural response phase along the 3D preferred direction for translation and rotation, respectively. Only neurons with significant single harmonic responses (p_f1<0.01) along at least one motion direction are included.

