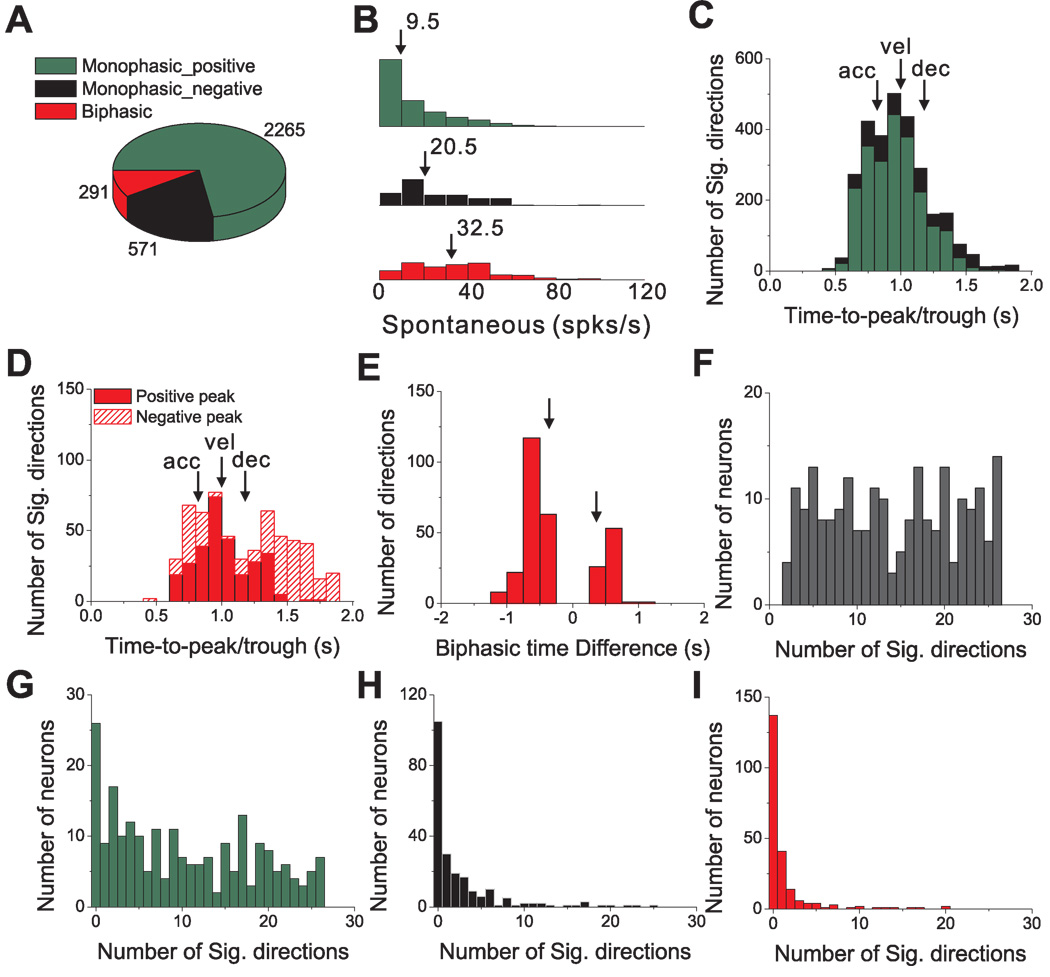
Figure 6.
Summary of temporal response modulation during 3D transient translational motion. (A) Prevalence of monophasic positive (green), monophasic negative (black) and biphasic (red) temporal modulation profiles for all responsive motion directions (p<0.01) in 220 cells. (B) Histograms of spontaneous firing rates for monophasic positive, monophasic negative and biphasic responses; differences between groups were statistically significant (p<0.001, Wilcoxon signed-rank test). (C) Distribution of peak latency for monophasic responses. Vertical arrows mark the times of peak stimulus acceleration (‘acc’, at 0.82s), velocity (‘vel’ at 1s) and deceleration (‘dec’, at 1.18s). (D) Distributions of peak response latency for biphasic responses. Red filled bars represent peaks; red hatched bars represent troughs. (E) Distribution of the time difference between the peak and trough of biphasic responses. Vertical arrows mark the corresponding timing differences between peak stimulus acceleration and deceleration. (F) Distribution of the number of stimulus directions that elicit significant responses for each responding cell (n=220). (G)–(I) Distributions of the number of significant response directions, now separated for monophasic-positive (G), monophasic-negative (H) and biphasic (I) response profiles, respectively.

