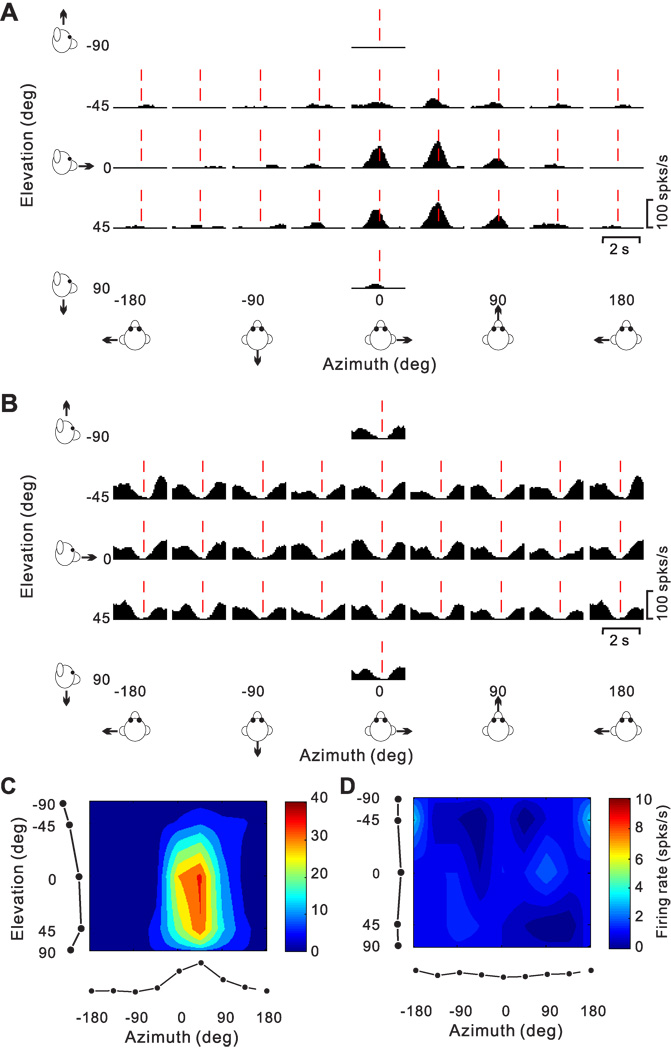
Figure 7.
Responses of two PIVC neurons to 26 directions of transient translational motion. Azimuth and elevation are defined as in Fig. 4. (A) Average response PSTHs for a single-peaked neuron. Vertical dashed red lines indicate the peak time (0.94 s) when the maximum response across directions occurred. (B) Average response PSTHs for a neuron with inhibitory responses. Vertical dashed red lines indicate the peak time (1.2 s) when the minimum response across directions occurred. (C) Color contour map showing 3D directional tuning (Lambert cylindrical projection) at peak time for the cell in A (DDI=0.77). Tuning curves along the margins of the color map illustrate mean firing rates plotted versus elevation or azimuth (averaged across azimuth or elevation, respectively). (D) Color contour map showing spatial tuning at peak time of the inhibitory neuron in B; the cell was not significantly direction–selective at the peak time (shown) nor at any other time during the 2s duration of the motion stimulus.

