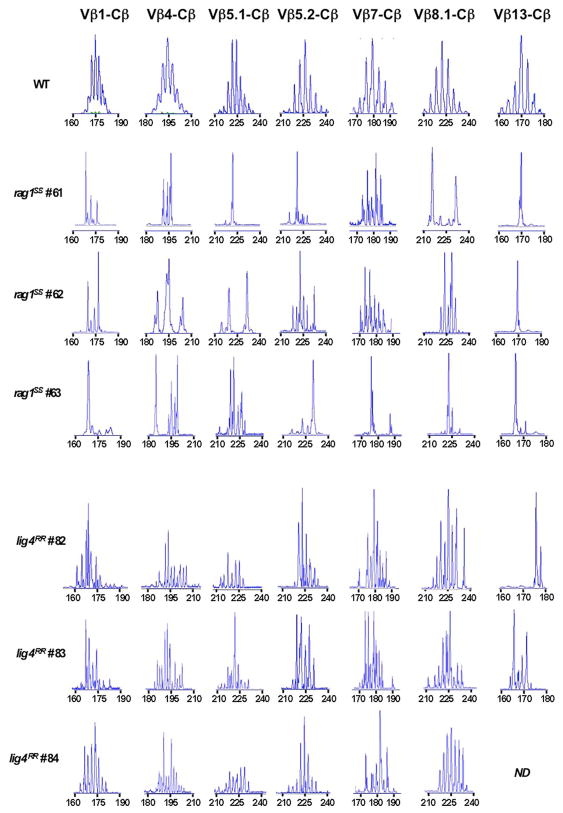
FIGURE 3. Immunoscope analysis of TCR repertoire in the thymus of rag1S/S and lig4R/R mice.
Representative immunoscope profiles of TCRVβ repertoire in the thymus of one WT, three rag1S/S and three lig4R/R mice. Profiles are shown for 7 of the 24 distinct TCR Vβ-Cβ amplification products analyzed. The x axis represents CDR3 length, and arbitrary fluorescence intensity of the run off products is shown on the y axis. ND: not done.

