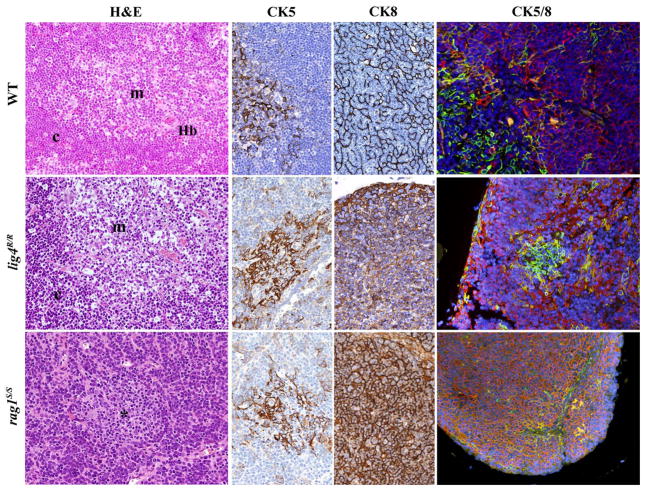
FIGURE 4. Thymic architecture in wild-type, lig4R/R, and rag1S/S mice.
Analysis of thymic architecture and cytokeratin (CK) expression in WT, lig4R/R, and rag1S/S mice. Thymic architecture with identification of cortex (c) and medulla (m) is shown in the first column on the left by hematoxylin and eosin (H&E) staining. The second and third columns show distribution of CK5+ and CK8+ epithelial cells, respectively. Panels in the right column represent dual immunofluorescence (IF) analysis for CK8+ (in red) and CK5+ (in green) cells. Yellow staining identifies cells co-expressing CK5 and CK8. Nuclei are counterstained with DAPI. H&E staining shows normal cortico-medullary demarcation (CMD) in both WT and lig4R/R mutant mice, whereas only focal areas of medullary differentiation (asterisk) are appreciated in rag1S/S mice. A normal distribution of both CK5+ cells, that represent the vast majority of mTECs, and CK8+ cells, that design a fine meshwork of cTECs (upper middle panels, CK5, and CK8 staining), with clear separation between them, is present in WT mice, as shown by IF (upper right panel). Thymuses from lig4R/R mutant mice show CMD with normal distribution of the CK5+ and CK8+ cells, although the CK8+ cTECs show a coarse distribution with a globular morphology (middle panels). A well-defined, but tiny thymic medulla is visualized by IF in lig4R/R mice (right panel). In contrast, thymuses from rag1S/S mice show impaired CMD (H&E, left panel); staining for CKs shows diffuse expression of CK8, and focal expression of CK5 (middle panels). IF shows increased presence of CK5+ CK8+ double positive immature TECs in rag1S/S mice (right panel). All panels are from 20× original magnification. One representative example of 5 mice analyzed per each strain.

