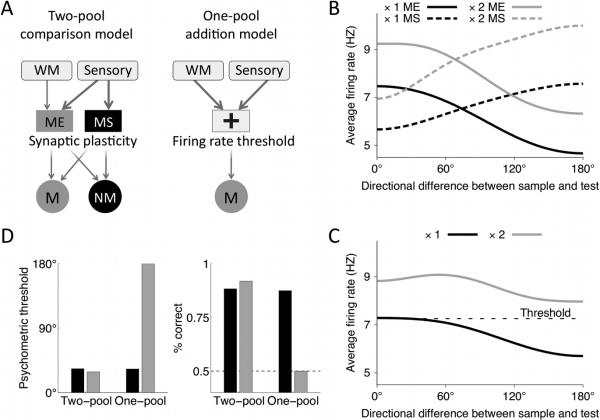
Figure10.
Behavioral performance in the two-pool comparison model, but not in the one-pool addition model, is robust to changes in the sensory input strength. (A) Schematics of the two-pool comparison model (simplified version of Figure 1E) and of the one-pool addition model (see Material and Methods for details). (B) Average population firing rate for the ME (solid line) and MS (dashed line) neurons in the two-pool model as a function of directional difference between the sample and test. Black line: control; gray line: doubled sensory input strength. The difference in the activity of ME and MS neurons is only slightly affected by the increase in the input strengths, while the firing rates in both populations increase significantly. (C) Average population firing rate for the addition population in the one-pool model as a function of directional difference between the sample and test. Black line: control; gray line: doubled sensory input strength. The black dashed line indicates the firing rate threshold for match vs. nonmatch decisions, obtained by fitting the parameters of the readout (Equation 14) so as to match the psychometric functions for the one- and two-pool models in the control condition. (D) In the two-pool model, the psychometric threshold and overall performance remain almost the same for the control (black bar) and doubled (gray bar) input strength. In the one-pool model the overall performance decreases and the psychometric threshold increases with the input strength. For the doubled input strengths (gray bar) performance drops to the chance level (dashed line), and the psychometric threshold (defined at 75% correct performance) cannot be determined, for comparison purpose we plot the maximum possible threshold value 180°.

