Figure 6.
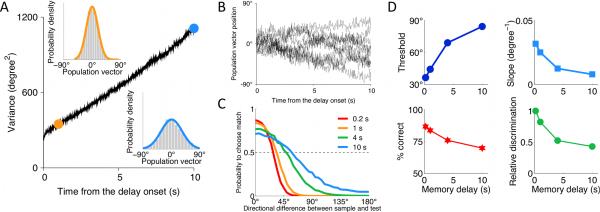
Degradation of performance in the DMS task with memory delay. (A) Memory of the sample is encoded by the peak location of the bell-shaped persistent activity pattern in the WM circuit (see Materials and Methods). Variance of the remembered sample growths linearly with time, consistent with a diffusion process. Insets show the probability density for the remembered sample after 1 s (orange) and 10 s (blue) delays (grey histogram: simulations; solid color line: Gaussian fit). (B) Example traces for the peak location of the persistent activity pattern in the WM circuit, which represents the sample memory during the delay. (C) Psychometric function in the DMS task for different durations of the memory delay. (D) Psychometric threshold increases and the slope of the psychometric function decreases for longer delays. The overall performance decreases for longer delays, but remains at relatively high level for all delays. Relative discrimination (ratio of the threshold at 0.2 s delay to the threshold at longer delays) decreases with the delay duration, which accounts for the psychophysical observations with monkeys (Pasternak and Greenlee, 2005). Stimulus statistics is the same as in Figure 7 for p0 = 0.5.

