
Figure 8.
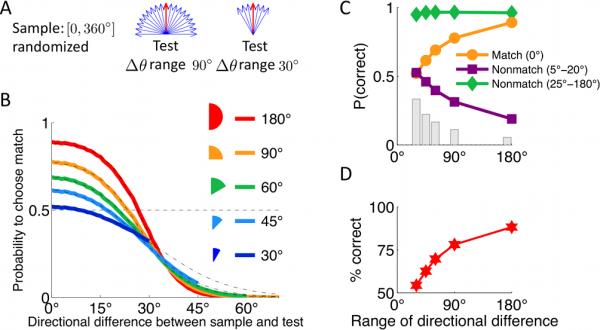
Range of sample-test similarities affects performance on the DMS task. (A) Schematic of stimulus statistics with different ranges of sample-test similarities. Nonmatches differ from the sample by Δθ = {±5°,±10° ... ± Ψ }, which are all equally probable, and Ψ is the range of directional differences. Prior probability for a match trial is fixed at p0 = 0.5. (B) As the range Ψ decreases, the number of erroneous match decisions for small Δθ ≠ 0° decreases, but the number of correct match decisions for Δθ = 0° also decreases. (C) Probabilities to correctly identify a match ( Δθ = 0°) and a nonmatch that is similar (| Δθ | = 5° - 20°) and dissimilar (|Δθ | = 25° - 180°) to the sample are plotted for five Ψ values. The probability to correctly identify dissimilar, easily discernible nonmatch (green diamond) is always high. As the range Ψ decreases, the probability to correctly identify very similar nonmatch (purple square) increases along with its prior probability (grey bar), while the probability to correctly identify match (orange circle) decreases. (D) Overall performance decreases as the range of directional differences becomes very narrow.