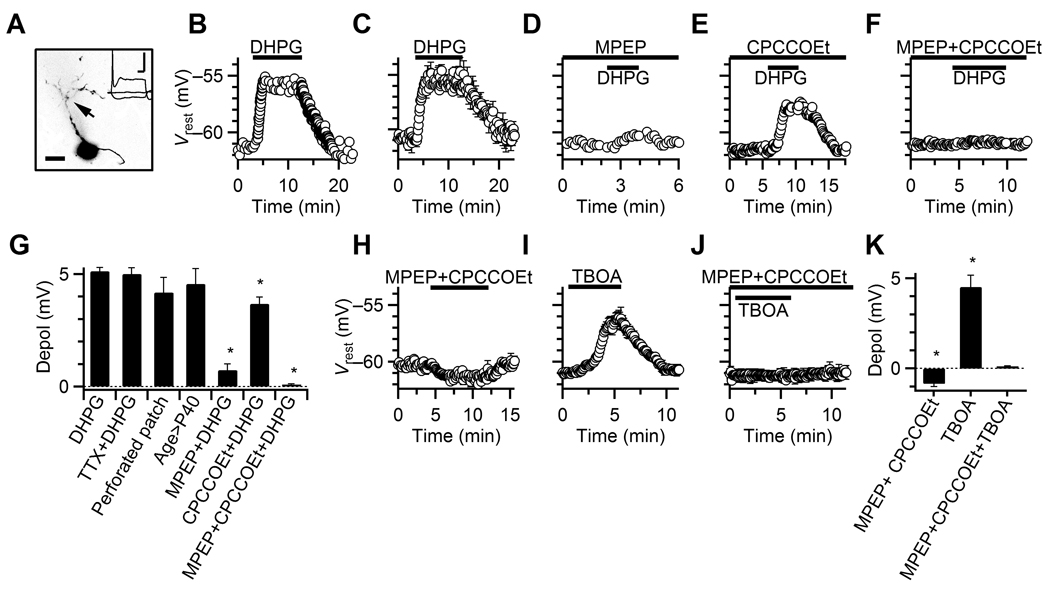
Figure 1. Activation of group I mGluRs depolarizes BCs.
A. Confocal image of a representative BC loaded with Alexa-594. Arrow indicates BC dendrite. Inset, response to current-pulses of −150, 0, or 600 pA, used to identify the cell type. Scale bars = 10 µm, 10 ms, 20 mV.
B. Response of a representative BC to DHPG application.
C. Average Vrest for experiments similar to B. Data points are averages of 3–7 experiments.
D–F. Representative experiments showing the effects of DHPG on Vrest, in the presence of MPEP (D), CPCCOEt (E) and MPEP+CPCCOEt (F).
G. Relative depolarization for experiments similar to panels B–F. Asterisks indicate depolarizations significantly lower than in DHPG alone. Bars are averages of 3–39 experiments.
H–J. Average effects on Vrest of MPEP+CPCCOEt (H, 7 cells), TBOA (I, 5 cells), and TBOA+MPEP+CPCCOEt (J, 3 cells).
K. Relative depolarization for experiments similar to panels H–J. Asterisks indicate significant hyperpolarization or depolarization. Bars are averages of 3–9 experiments.

