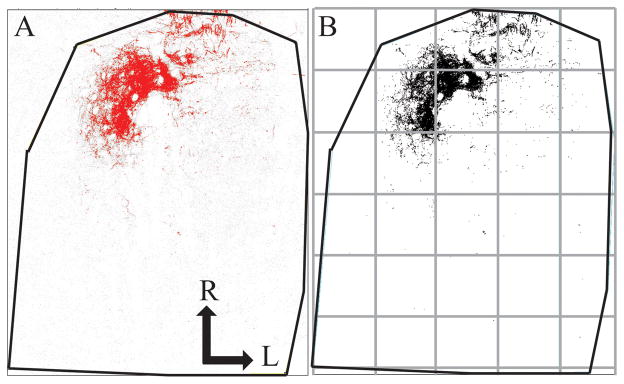
Figure 2. Method for measuring terminal field volume and density.
Confocal stacks of the chorda tympani nerve terminal field were rotated in ImageJ so the solitary tract was orientated vertically, the borders of the NTS were defined, and the stack was cropped to include only the NTS. The maximum entropy thresholder algorithm was applied to the stack. For each optical section, pixels above threshold (A, red) were overlaid on the raw imaged (A, grey). A binary image of the pixels above threshold (B) represents data that were analyzed using particle analysis. The NTS in the horizontal plane (outline shown in black lines) was subdivided into 200 pixel × 200 pixel uniform grid boxes for density analysis, with the grid (see grey boxes) arranged relative to the NTS with the most medial and rostral borders of the NTS as the 0,0 coordinate. R, rostral; L, lateral.

