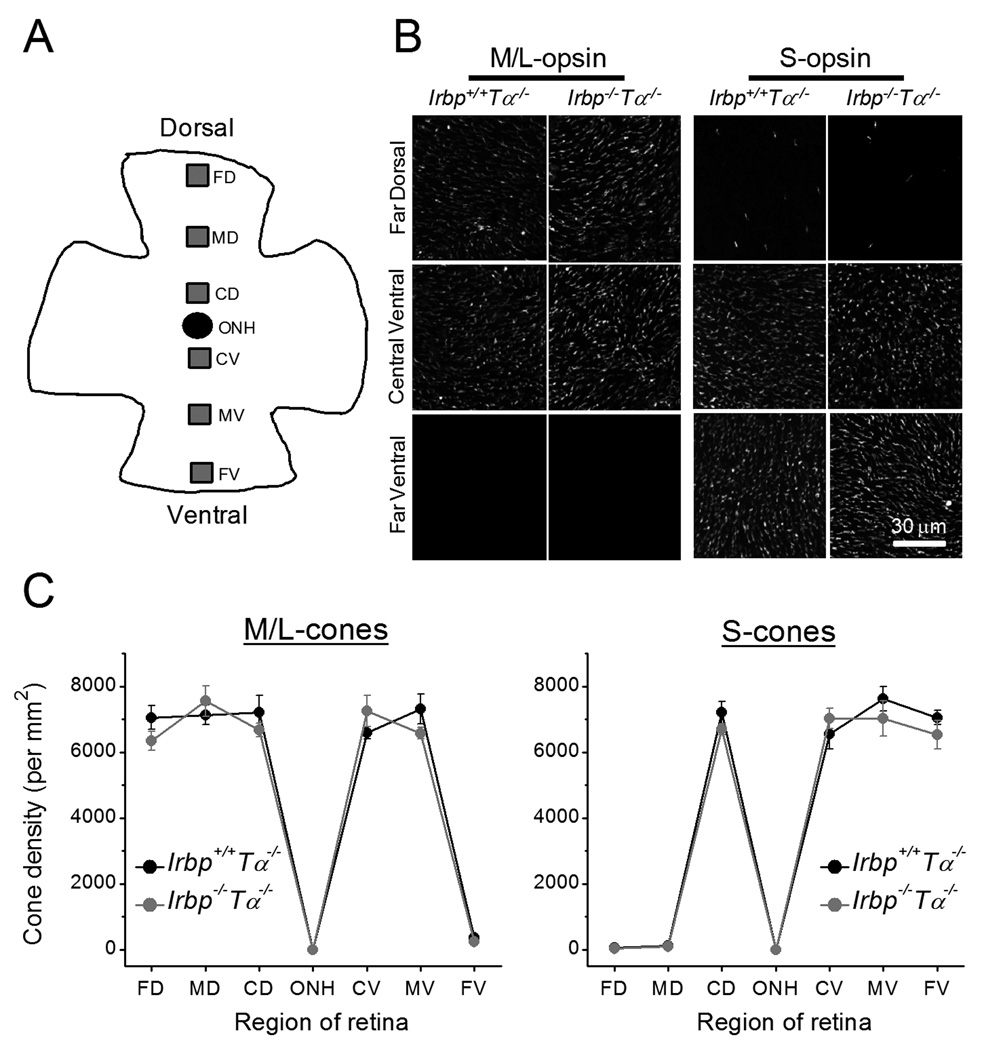
Figure 1.
Cone densities in 2-month-old Irbp−/−Tα−/− mice. A, Schematic representation of retinal flatmount with the six regions analyzed for cone density spanning the dorsal-ventral axis. FD: far-dorsal, MD: mid-dorsal, CD: central-dorsal, ONH: optic nerve head, CV: central-ventral, MV: mid-ventral, FV: far-ventral. B, Images of flatmounted retinas stained with M/L- (left) or S- (right) cone opsins. Scale bar, 30 µm. C, No differences in M/L- (left) or S- (right) cone densities are observed between retinas of Irbp+/+Tα−/− (n = 4) and Irbp−/−Tα−/− (n = 4) mice. Values are means ± SEM. The p-values are > 0.05 for all retina locations in both panels.

