. Author manuscript; available in PMC: 2011 Nov 25.
Published in final edited form as: J Neurosci. 2011 May 25;31(21):7900–7909. doi: 10.1523/JNEUROSCI.0438-11.2011

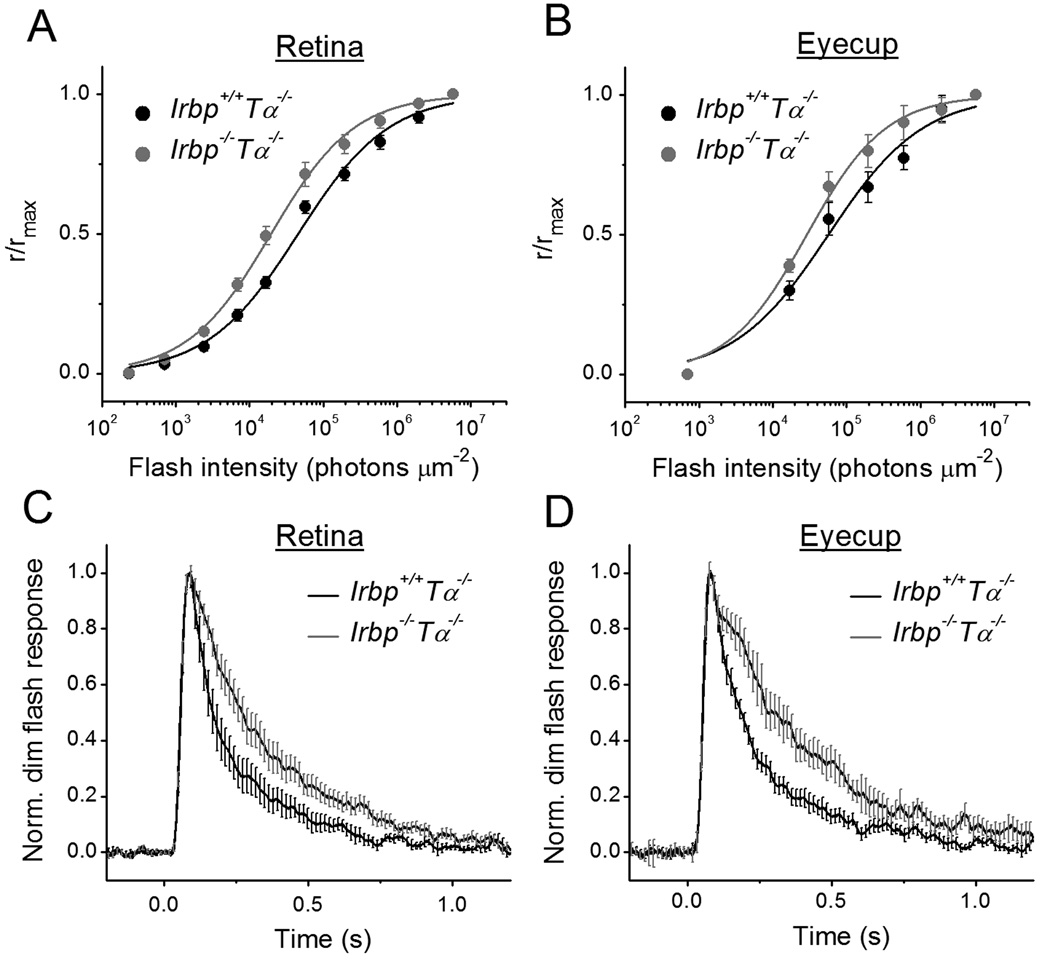
Figure 4.

Figure 4

Sensitivity (I1/2) and kinetics of M/L-cone photoresponses in Irbp−/−Tα−/− mice. Normalized averaged intensity-response relations of isolated retinas (A) and eyecups (B). Points were fitted with Naka-Rushton hyperbolic functions, as follows:
RRmax=InIn+I1/2n,
where R is the transient-peak amplitude of response, Rmax is the maximal response amplitude, I is the flash intensity, n is the Hill coefficient (exponent), and I1/2 is the half-saturating light intensity. A, Retinas: Irbp+/+Tα−/− (n = 13), Irbp−/−Tα−/− (n = 11). Half-saturated intensities (I1/2) were 4.5 × 10⁴ and 2.0 × 10⁴photons µm−2, and exponents were 0.71 and 0.77, respectively. B, Eyecups: Irbp+/+Tα−/− (n = 7), Irbp−/−Tα−/− (n = 7). Half-saturating intensities were 5.5 × 10⁴ and 2.9 × 10⁴ photons µm−2, and exponents were 0.69 and 0.80, respectively. C, D, Population-averaged normalized responses to 1.7 × 10⁴ photons µm−2 test stimuli. Error bars represent SEM. C, Retinas: Irbp+/+Tα−/− (n = 7), Irbp−/−Tα−/− (n = 12). D, Eyecups: Irbp+/+Tα−/− (n = 18), Irbp−/−Tα−/− (n = 16). Dim flash recovery time constants (τrec) determined from single-exponential fits (not shown) were ~ 180 ms (Irbp+/+Tα−/−) and 300 ms (Irbp−/−Tα−/−), respectively.