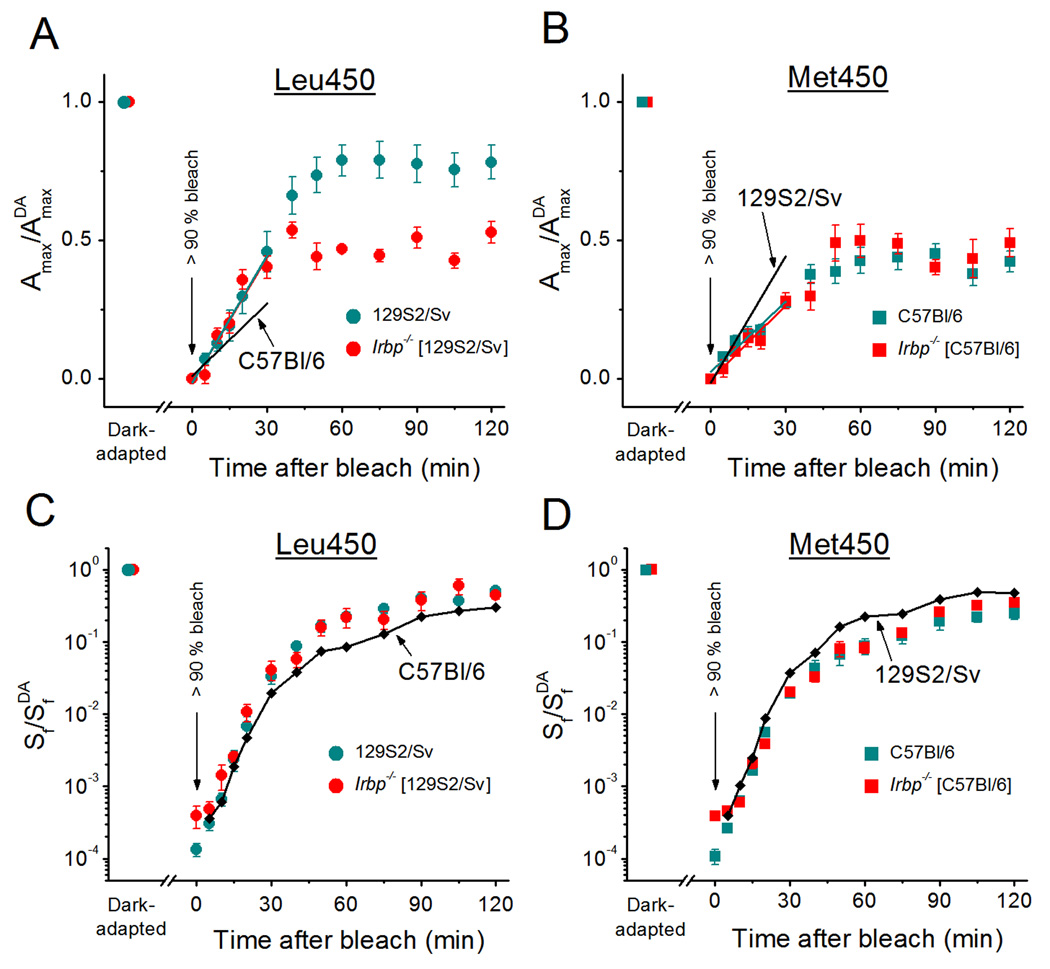
Figure 7.
Recovery of rod ERG a-wave amplitude (Amax) (A, B) and flash sensitivity (Sf) (C, D) after bleaching > 90% of rod visual pigment in four strains of mice: 129S2/Sv (n = 5 mice) and Irbp−/− (129S2/Sv background, n = 5 mice) having a Leu450 variant of RPE65 (A, C); C57Bl/6 (n = 5 mice) and Irbp−/− (C57Bl/6 background, n = 4 mice) having a Met450 variant of RPE65 (B, D). The parameters were normalized to their dark-adapted values (AmaxDA and SfDA). Bleaching was achieved by 30 s illumination with 520 nm LED light at time 0. All values are means ± SEM. Data in (A, B) were corrected for the residual a-wave of ~ 25–50 µV, presumably generated by M/L-cones, that was observed immediately after the bleach. Straight lines in (A, B) are linear fits to the initial data points (up to 30 min): cyan and red lines represent fits to the data from mouse strains indicated in the corresponding legend; black lines indicate averaged fits to the data from the two mouse strains having the opposite variant of RPE65 (shown for comparison of initial rates of dark adaptation). Small black symbols connected with black lines in (C, D) represent averaged data from the two mouse strains having the opposite variant of RPE65 (shown for comparison of Sf recovery).

