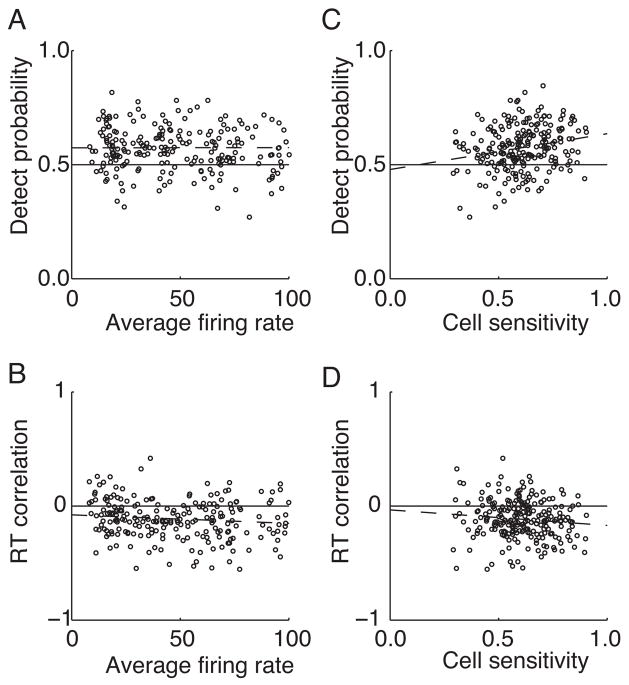
Figure 7.
The effect of firing rate and cell performance on DP and RTC. Only trials with coherent motion within 45° of the preferred direction are included. Each cell can contribute up to 5 points to each plot. DP values were obtained based on activity 400 – 500 ms after the onset of coherent motion. RTC values were obtained based on activity 200 – 300 ms after onset of coherent motion. A) DP vs. average firing rate (r = 0.00, p = 0.98, slope = 0.00001). B) RTC versus firing rate. A weak trend is observed for RTC to vary by firing rate (r = 0.13, p = 0.04, slope = −0.0007/°). C) DP versus cell performance. Cell performance is measured by an ROC analysis of the firing rate obtained in response to the non-coherent motion versus the firing obtained for the coherent motion. A small but significant trend is observed for larger DP for cells that had better detection performance (r = 0.22, p = 0.001, slope = 0.16). D) RTC versus cell detection performance. Again a weak trend is observed for RTC to depend on cell performance (r = 0.11, p = 0.10, slope = −0.14).

