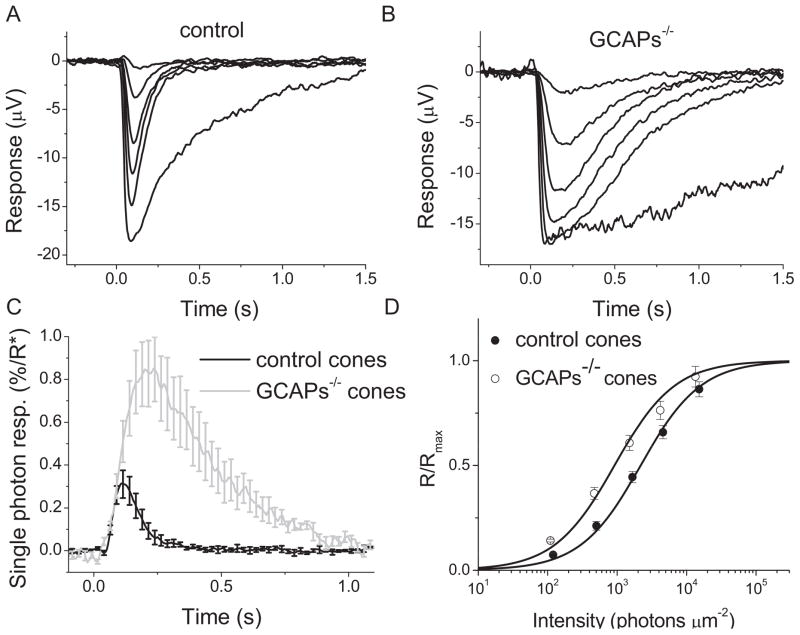
Figure 4.
Flash response families of dark adapted control cones (A) and GCAPs−/− cones (B) from transretinal recordings. Cone responses were evoked by a series of 500-nm test flashes (10 ms in duration) with intensities (photons μm−2) 36, 1.2 × 10², 3.9 × 10², 1.1 × 10³, and 3.6 × 10³. The largest response in each case was triggered by unattenuated white flash. (C) Fractional single photon responses of control (black) and GCAPs−/− (gray) cones. Error bars show SEM. The cone collecting area was estimated to be 0.12 μm2 (see Eqn. (6) and Materials and Methods for details). (D) Intensity-response relations of cone transretinal responses to estimate sensitivity in control (closed circles) and GCAPs−/−(open circles) retinas. The solid curves represent the corresponding intensity-response functions (Eqn. (1)) with Io of 2,180 photons μm−2 and 918 photons μm−2, respectively. Error bars show SEM.

