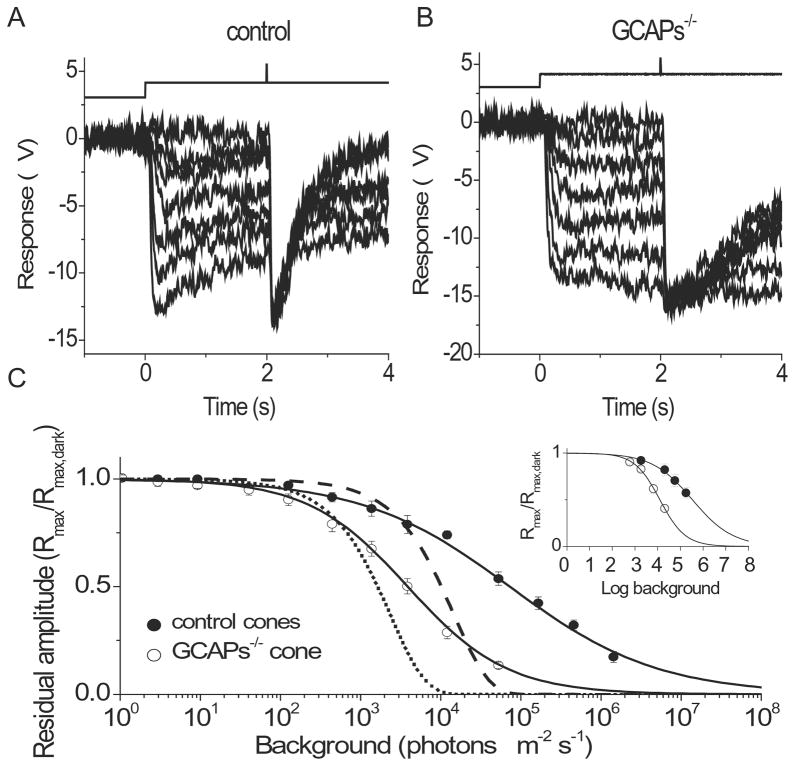
Figure 5.
Effect of background light on cone operating range in control and GCAPs−/− retinas. Maximum cone response amplitudes under a series of background lights were measured 2 s after the onset of step light illumination in control (A) and GCAPs−/− (B) retinas by a test flash of unattenuated white light. The time course of light stimulation is shown on the top of each panel. The step light intensities (photons μm−2 s−1) were 0, 440, 1.3 × 10³, 3.9 × 10³, 1.2 × 10⁴, 5.2 × 10⁴, and 1.7 × 10⁵ for control retina and 0, 130, 440, 1.3 × 10³, 3.9 × 10³, 1.2 × 10⁴, and 5.2 × 10⁴ for GCAPs−/− retina. (C) Normalized maximum cone responses as a function of background intensity for control (filled circles) and GCAPs−/− (open circles) retina. The smooth curves represent best-fitted Hill equation (see Eqn. (2)) with k = 0.47 and 0.70, IR = 94,300 and 3,900 photons μm−2 s−1 for control and GCAPs−/−, respectively. Error bars show SEM. The dashed and dotted curves represent the expected change in maximum response of control and GCAPs−/− cones, respectively, in the absence of adaptation (see Eqn. (4)). (Inset) Normalized maximum cone response as a function of background intensity for control (n = 5) and GCAPs−/− (n = 5) cones obtained with single-cell recordings. The curves represent best-fitted Hill equations with k = 0.49 and 0.78, IR = 3.4 × 10⁵ and 1.2 × 10⁴ photons μm−2 s−1 for control and GCAPs−/− cones, respectively.

