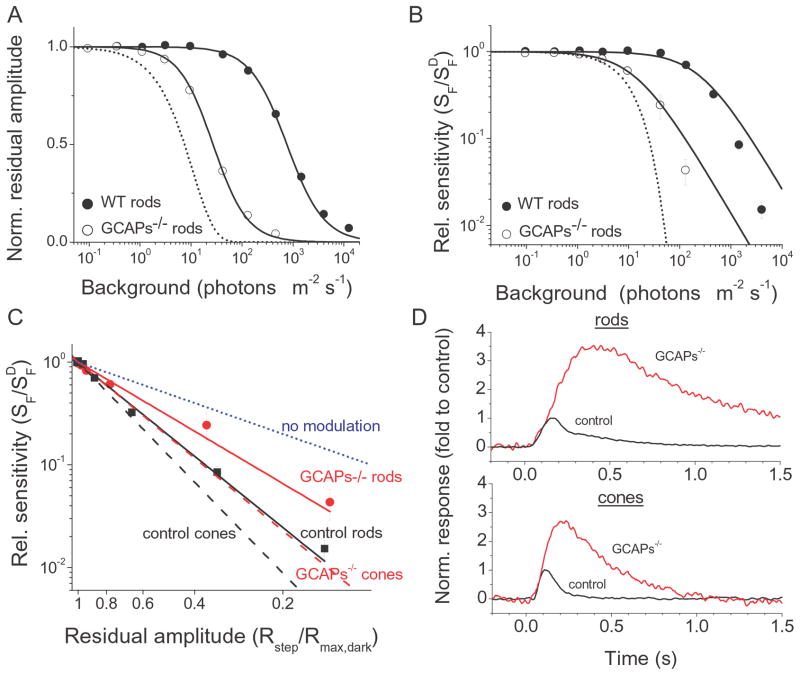
Figure 7.
(A) Normalized maximum rod responses as a function of background intensity for control (black circles, n = 10) and GCAPs−/− (open circles, n = 7) retina. The smooth curves represent best-fitted Hill equation with k = 1.20 and 1.29, IR = 756 and 27 photons μm−2 s−1 for control and GCAPs−/− rods, respectively. Error bars show SEM. The dotted curve represents the expected change in maximum response of GCAPs−/− rods in the absence of adaptation (Eqn. (4)). (B) Relative sensitivity as a function of background intensity. Flash sensitivity (SF) was determined for each retina by dividing the peak amplitude of dim flash response by the flash intensity and the maximal amplitude for each retina. SFD is flash sensitivity in darkness. Averages of control (closed circles, n = 10) and GCAPs−/− (open circles, n = 7) retinas. Solid lines are best fitting Weber-Fechner functions with IS = 272 (WT) and 14 (GCAPs−/−) photons μm−2 s−1. The dotted curve represents the expected change in sensitivity of GCAPs−/− rods in the absence of adaptation (Eqn. (4)). (C) Relative sensitivity (SF/SFD) as a function of residual amplitude (Rmax/Rmax, dark). The decline in sensitivity against the reduction of residual amplitude (indicative of calcium level) for both rods and cones was substantially shallower in GCAPs−/− retinas than in control retinas. The parameters of the best fitting power functions are 2.30 for control rods (solid black line) and 1.69 for GCAPs−/− rods (solid red line). The dashed lines are the fitting functions for control cones (black) and GCAPs−/− cones (red) from Fig. 6D. The blue dotted line represents the expected change in sensitivity in the absence of Ca2+-modulation. Error bars show SEM. (D) Single photon responses of rods (top) and cones (bottom) normalized by dividing them by their respective control peak amplitudes. The time of divergence of the GCAPs−/− (red) responses from control (black) responses was 120 ms for rods and 85 ms for cones.

