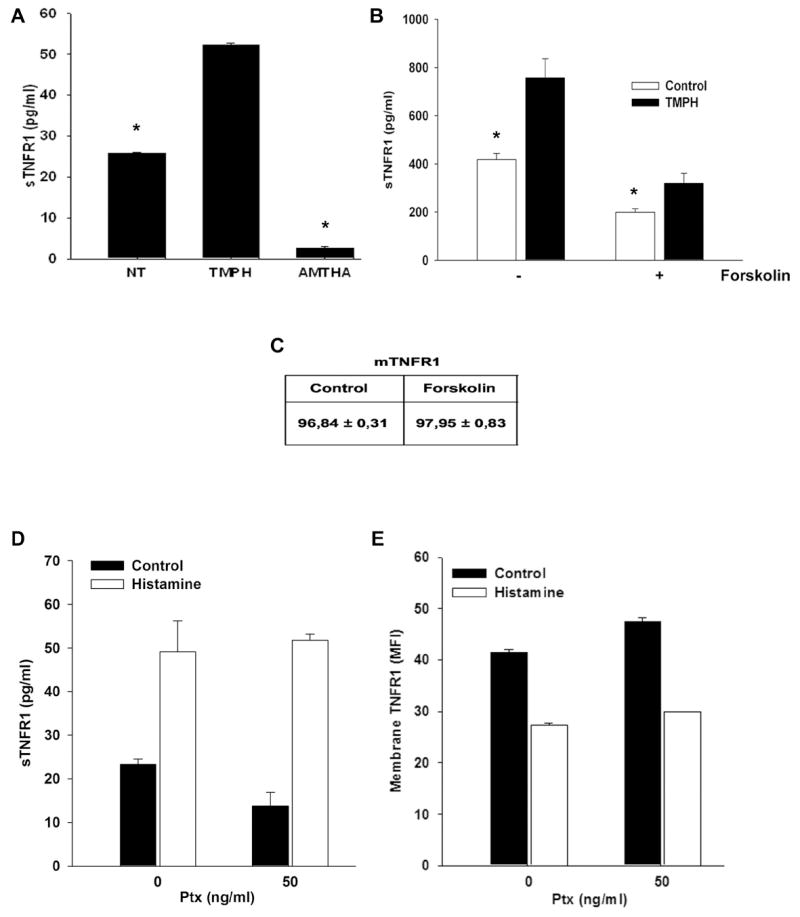
Figure 2. Forskolin reduced both constitutive and TMPH-stimulated release of TNFR1.

(A) Effect of 500 μM AMTHA and 100 μM TMPH on sTNFR1 release. (B) Cells were preincubated with 10μM forskolin or with vehicle alone prior to TMPH treatment and soluble TNFR1 was measured by ELISA assay. (C) Values indicate the mean fluorescence intensity measured by FACS analysis of membrane TNFR1 in both forskolin- and vehicle-treated cells. Effect of Ptx treatment on both sTNFR1 release (D) and mebrane TNFR1 expression. Data are representative of two independent experiments. (*, P value <0.05).
