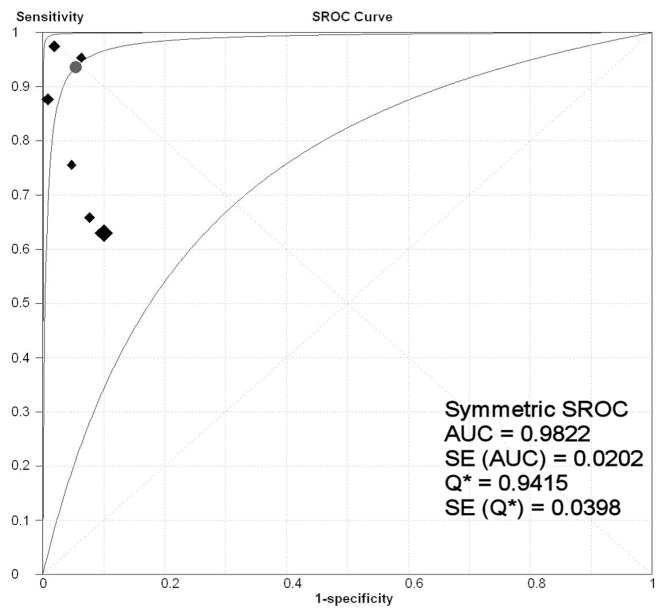
Fig 1.
SROC curve for the CTA meta-analysis. Each black diamond represents an individual research study in the CTA meta-analysis, with the size of the diamond directly proportional to the sample size of the study. The best fit curve (middle curve) lies between the other 2 curves, which demarcate its 95% CI. The circle denotes the Q*-point.

