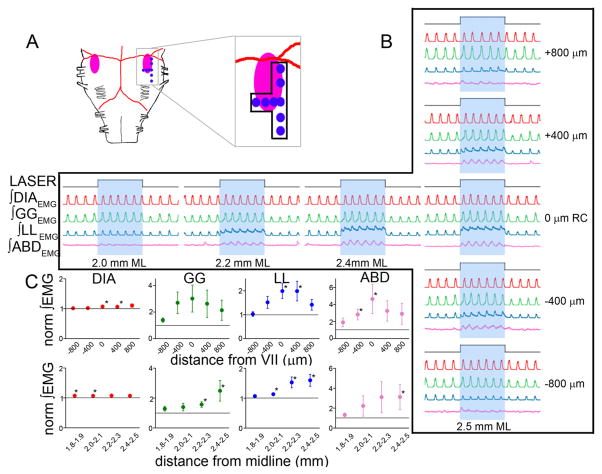
Figure 5.
Photostimulation on ventral medullary surface over RTN/pFRG in SYN-ChR2-EYFP-injected rats induced AE. A, Diagram of ventral brainstem surface (VIIn: pink) indicating photostimulation sites (blue dots correspond to sets of traces in B). B, Effects of 10 s photostimulus (top trace) on DIAEMG (red), GGEMG (green), LLEMG (blue), and ABDEMG (pink). Right, ±400 μm rostrocaudal (RC) intervals; middle, ±200 μm mediolateral (ML) intervals. C, Effect of 10 s photostimulus along the rostrocaudal (top; n = 5) and mediolateral (bottom; n = 4) axes on peak DIAEMG (red), GGEMG (green), LLEMG (blue), and ABDEMG (pink). The horizontal lines represent normalized control values before photostimulation. The asterisks indicate p < 0.05 between control and photostimulation.

