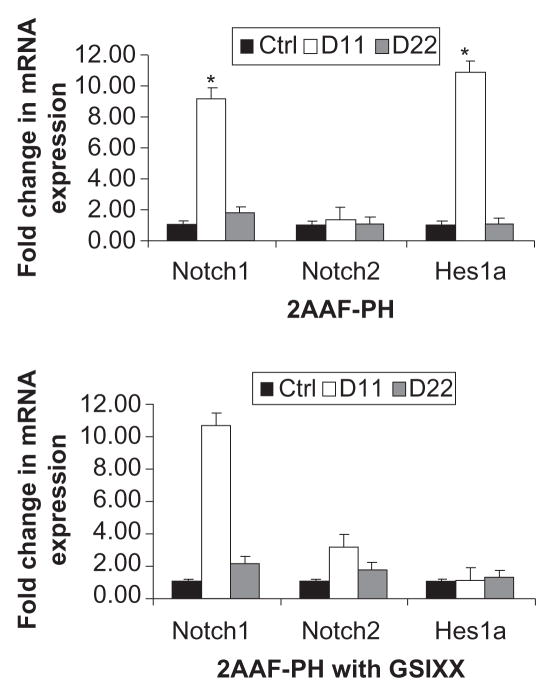
Figure 2.
Real-time PCR analysis of Notch pathway genes. A) Quantitative real-time polymerase chain reaction analysis shows an increase in Notch1 gene expression at day 11 post-PH in livers isolated from animals on the 2AAF-PH protocol as compared with controls. Notch1 expression returns to near normal levels by day 22 post-PH. This expression pattern is also seen when 2AAF-PH is combined with GSI XX treatments, B) as the inhibitor targets the signal at the protein level. A similar expression pattern is seen for downstream effector Hes1, which dramatically increases at day 11 post-PH alone and returns to basal levels by day 22 post-PH alone. Hes 1 was found to be significantly downregulated at day 11 post-PH in the GSI XX-treated group as compared with 2AAF-PH alone. Gene expression was normalized to β-actin and significance calculated compared with control animals. *P < 0.01; error bars, SD.
Abbreviations: GSI XX, γ-secretase inhibitor; PH, partial hepatectomy; 2AAF-PH, 2-acetylaminofluorine implantation followed by 70% surgical resection of the liver; PCR, polymerase chain reaction; SD, standard deviation.

