
Figure 1.
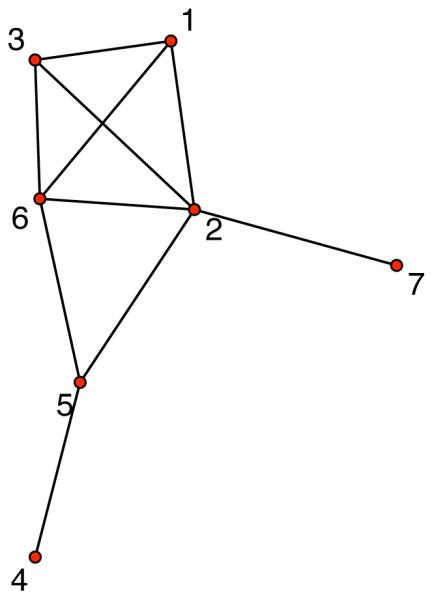
An example of a network on 7 nodes. The nodes are the red dots, labelled 1 to 7 and represent individuals in the population. The edges are shown as black lines connecting the nodes and represent possible routes of transmission. The degree of each node is number of edges adjacent to it, so that node 5 has degree 3 and node 7 has degree 1. The degree sequence of the network is the count of nodes with a given degree and can be represented by the vector (0, 2, 0, 3, 1, 1) showing that there are 0 nodes of degree 0, 2 of degree 1, 0 of degree 2 and so on. A cycle in the network is a path starting at a node and following distinct edges to end up back at the same node. For example, the path from node 6 to node 1 to node 3 and back to node 6 is a cycle but there is no cycle that includes node 4. Clustering is a measure of propensity of cycles of length 3 (triangles) to form. Here, the edges (2,1) and (2,6) form a triangle with the edge (1,6), so work to increase clustering in the network. However, the edges (2,1) and (2,5) do not comprise part of a triangle as (1,5) does not exist, so work to decrease clustering.