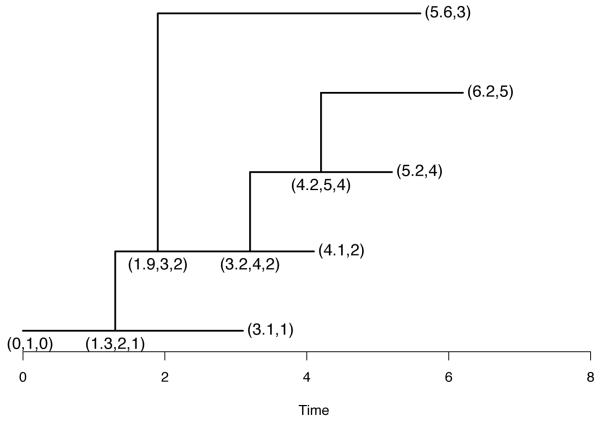
Figure 2.
An example of transmission tree showing the labelling scheme. Five individuals are involved in the epidemic and are labelled 1, … , 5. The root node is labelled (0, 1, 0) to signify that, at time t = 0, individual 1 was (spontaneously) infected. The internal nodes represent transmission events via a triplet such as (1.3, 2, 1) showing that, at time t = 1.3, individual 2 was infected by individual 1. The leaf nodes represent recovery times, for example (3.1, 1) means that, at time t = 3.1, individual 1 recovered. Note that this tree has one “cherry”, formed by the leaves labelled (5.2, 4) and (6.2, 5), out of a possible maximum of two cherries.

