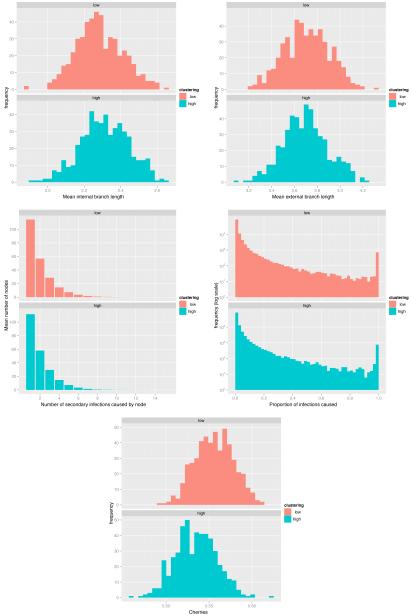
Figure 5.
Empirical distributions of summary statistics of transmission trees from epidemics on Bernoulli networks. (top left) Mean internal branch length; (top right) Mean external branch length; (middle left) Number of secondary infections by node; (middle right) Number of total infections by node, vertical axis on log-scale; and, (bottom) Number of cherries in tree as a proportion of possible cherries.

