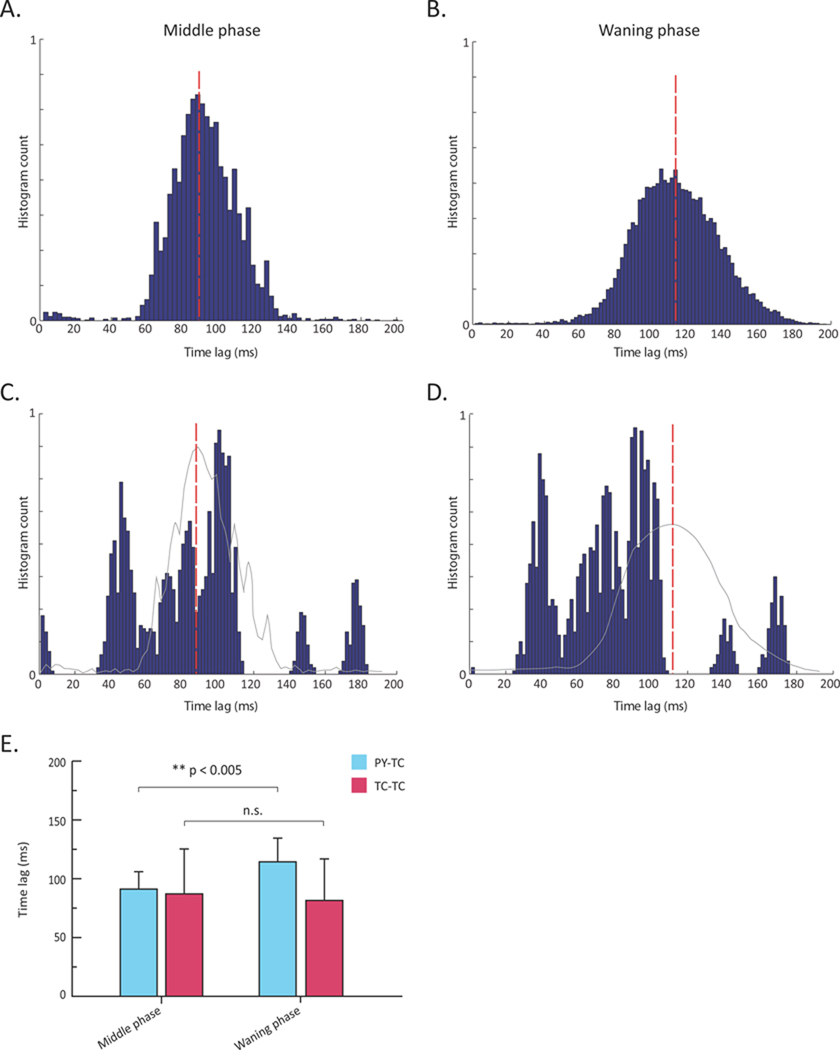
Fig. 6. Firing distribution triggered by IPSP in model TC neurons.
Time lag between TC and PY cells firing during the middle of a spindle (A) and during the waning phase (B). The envelope of the histogram in (B) has a lower amplitude and a wider distribution than in (A), suggesting great variance in the time lag differences between the IPSP before the TC burst and the onset of a spike in an afferent PY cell. The synchronization between cortical and thalamic cells during the middle of a spindle epoch is greater than during the waning phase.
Time lag between TC cells during the middle of a spindle (C) and during the waning phase (D). The red bars show the mean values of the histogram in (A) and (B), respectively. The envelope of the histograms in (A) and (B) are superimposed in gray in (C) and (D), respectively.
E. Bar plot of mean time lag differences. There was a significant difference between the means for (A) (91.2 ± 14.8) and (B) (114.3 ± 20.2) (p < 0.005) (left), but there was no significant difference between the means for (C) (87.1 ± 38.2) and (D) (81.5 ± 35.3) (right).

