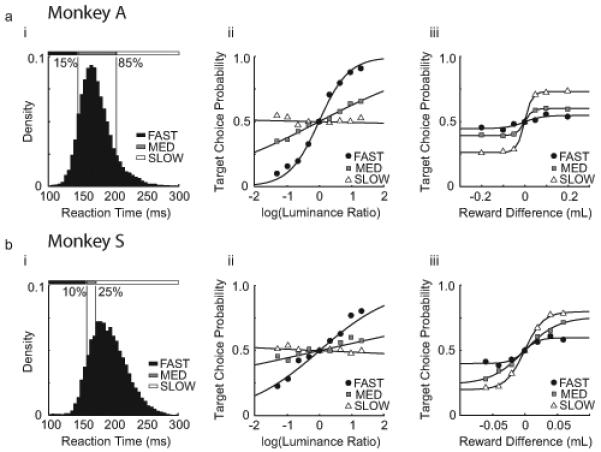
Figure 2. Reaction Time Governs The Influence of Luminance Contrast and Reward Difference on Choice Behavior.

(a) (i) Histogram of free choice reaction times for Monkey A. Data are partitioned into “Fast,” “Medium” and “Slow” categories to illustrate the variability of choice behavior over time. (ii) Summary of target choice probability vs log10(L T1/L T2) for the two targets, grouped according to the three reaction time categories described in a(i). (iii) Summary of target choice probability vs reward difference for the two targets, grouped according to the three reaction time categories described in a(i). (b) Same as a for Monkey S. Reaction time category boundaries were chosen so that marginal choice curves were qualitatively similar.
