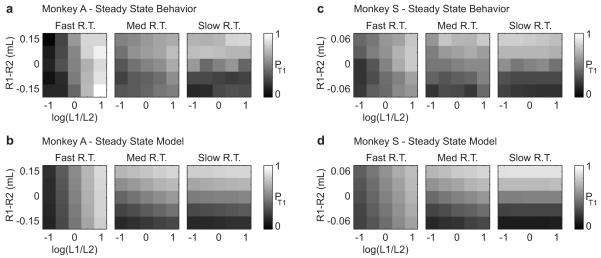
Figure 5. GLM fits reproduce the behaviorally observed time-dependent transition from luminance to reward dependence of target choice.
(a) Summary of T1 choice probability, pT1, as a function of log luminance ratio (x-axis), reward difference (y-axis) and reaction time for Monkey A behavioral data. In each panel, data are pooled over the corresponding reaction time interval from Figure 2 a(i). (b) Statistical fit of the data from (a) using the GLM described in Eqn (6). (c) Choice plots for Monkey S, obtained by grouping behavioral data using the reaction time intervals from Figure 2 b(i). (d) Statistical fit of the data from b using the GLM described in Eqn (7).

