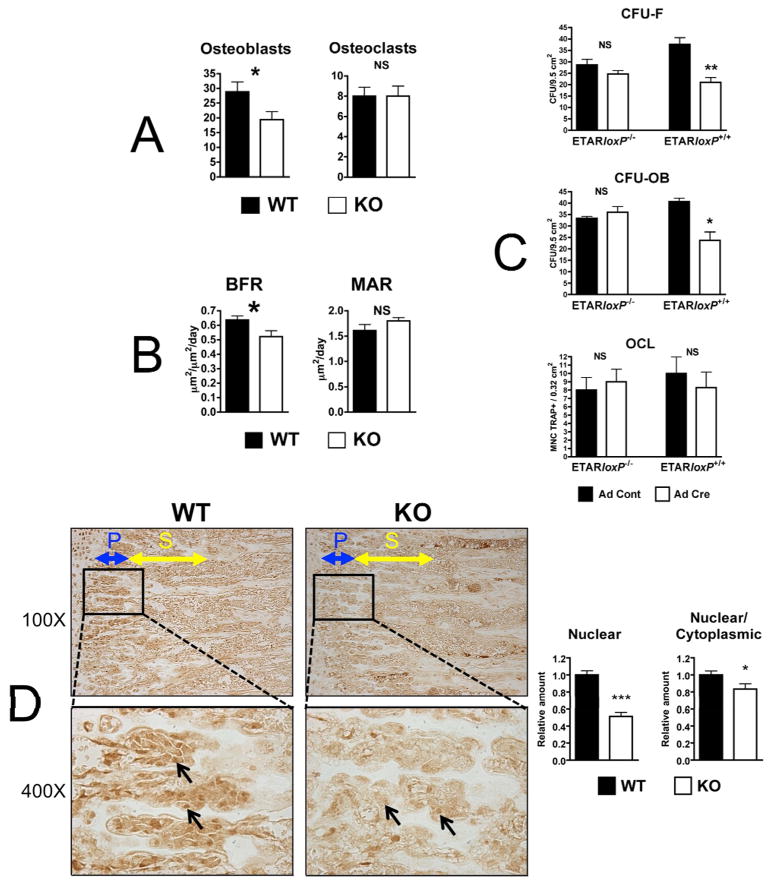
Fig. 4.
Lower osteoblast number, bone formation rate and osteoblast differentiation in KO mice. (A) Cellular density in 4-week-old mice tibiae was determined by counting the number of osteoblasts and osteoclasts (TRAP staining) per 200X field (0.24 mm2 area). (B) Dynamic histomorphometry was performed in 12-week-old mice measuring bone formation rate (BFR) and mineral apposition rate (MAR). (C) Bone marrow cells were isolated from ETARloxP−/− or ETARloxP+/+ mice and treated with adenovirus expressing Cre (Ad Cre) or control adenovirus (Ad Cont). Bone marrow culture analysis was performed for colony forming unit fibroblast (CFU-F), colony forming unit osteoblast (CFU-OB) and osteoclast formation (OCL). (D) Reduced osteoblast nuclear β-catenin and β-catenin nuclear/cytoplasmic ratio in KO mice. Tibiae of 4-week-old WT and KO males were stained for the active fraction of β-catenin. Images were obtained immediately below the growth plate, and primary (blue) and secondary (yellow) spongiosae are indicated in 100X magnification images. Inset boxes indicate area of 400X magnification. Arrows indicate osteoblasts. The 400X images were digitized. Multiple osteoblasts within the primary spongiosa were analyzed for nuclear and cytoplasmic β-catenin and staining intensity quantified. (*p ≤ 0.05; **p ≤ 0.01; ***p ≤ 0.001)

