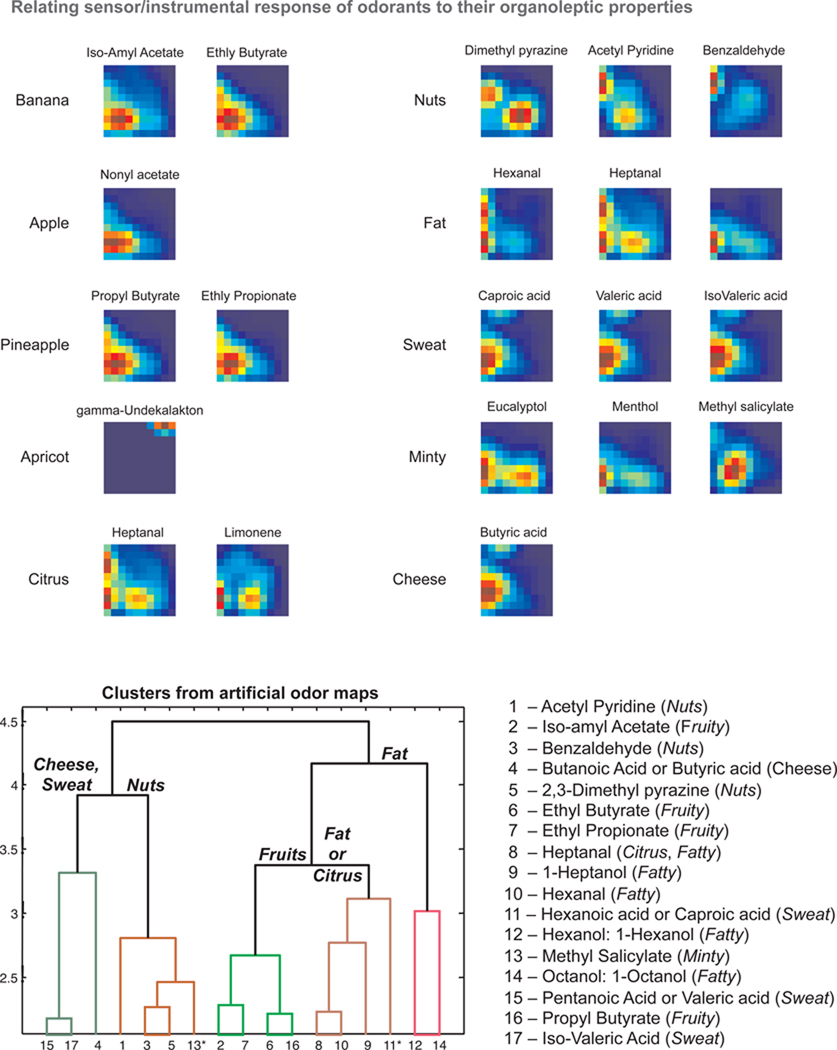
Figure 6.
Artificial odor maps show how sensor responses can be linked to perceptions. Top: Chemicals associated with ten different smell percepts predicted from their infrared absorption spectra were organized into these maps using the chemotopic convergence model (see Figure 5(a)). Dendrograms (complete-linkage) revealed that artificial odor maps formed from their infrared absorption spectra formed clusters determined by organoleptic descriptors provided by human experts (from Flavornet). A cluster analysis of olfactory bulb activation patterns elicited by the same seventeen chemicals (36) revealed qualitatively similar results (not shown). Asterisk identifies a chemical with a smell descriptor different from other members in the cluster. Reprinted with permissions from (92). With kind permission of Springer Science + Business Media.

