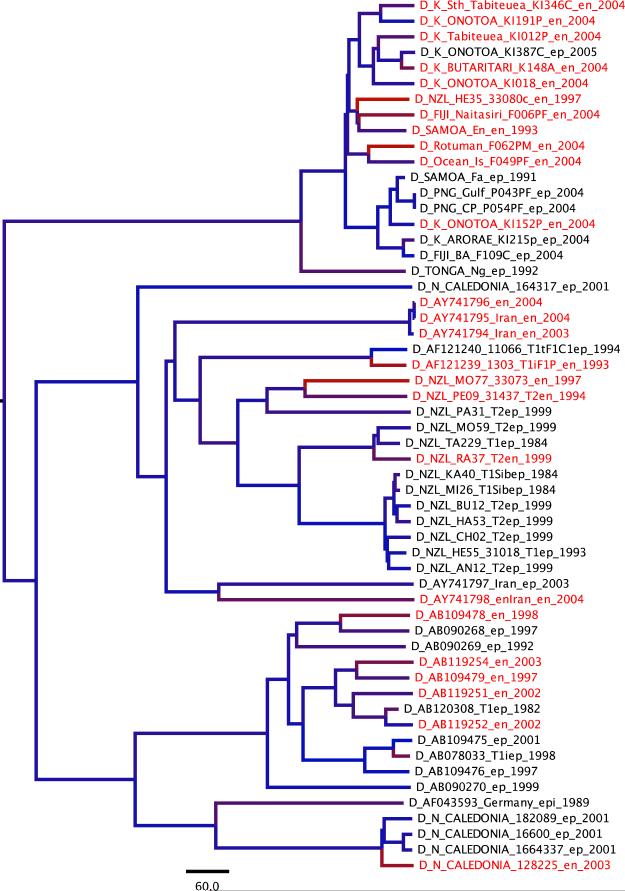
Figure 1.
Maximum clade credibility (MCC) resulting from the analysis of the Genotype D between-host data set. Colors along the branches indicate relative rates, from a scale of blue (the most slowly-evolving branches) to red (the most rapidly-evolving branches). Taxon labels of the most rapidly evolving branches are highlighted in red.

