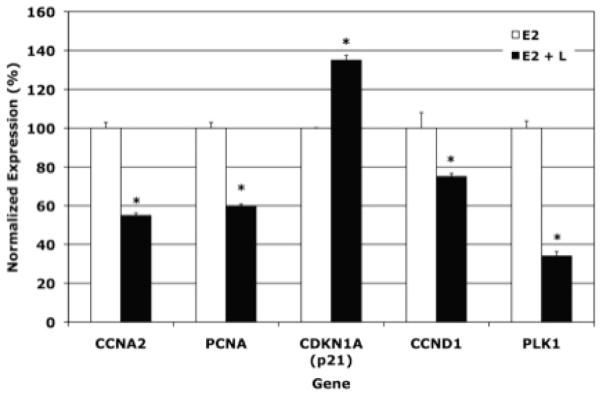
Figure 5. qPCR Analysis of Cell Cycle Gene Expression.

MCF-7 Cells were treated as described in Figure 2. RNA from these cells was analyzed by real-time PCR (qPCR) as described in Figure 3. The estradiol treatment group (used for control) represents the 100% value. RNA expression in the estradiol + luteolin treatment group is expressed as a % of the estradiol control. Data were analyzed statistically by ANOVA and a test on the treatment means (Instat, Graphpad Software). *p<0.0001.
