Figure 4.
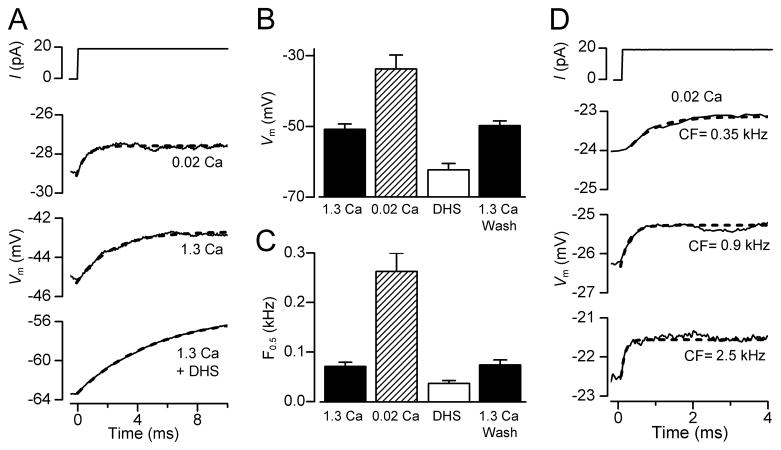
Resting potentials and membrane time constants (τm) in gerbil OHCs. (A) Voltage responses to current steps in an apical OHC with the hair bundle exposed to 1.3 mM Ca2+, 0.02 mM Ca2+ and 0.2 mM DHS + 1.3 mM Ca2+. Note low Ca2+ depolarizes the OHC and reduces τm. Blocking MT channels with DHS hyperpolarizes the OHC and increases τm. τm was obtained by fitting voltage onsets (dashed lines) with: V = A(1 − exp (−t/τm)), where τm = 2.3 ms (1.3 Ca2+), 0.6 ms (0.02 Ca2+), 5.3 ms (1.3 Ca2+ + DHS). (B) Collected resting potentials (mean ± SEM) from apical OHCs with bundles exposed to 1.3 mM Ca2+ (control, n = 15; wash, n = 14), 0.02 mM Ca2+ (n= 5) and 0.2 mM DHS + 1.3 mM or 0.02 mM Ca2+ (n = 9). (C) Collected corner frequencies (F0.5 = 1/2πτm; mean ± SEM) calculated from τm measurements as in (A), numbers of measurements in each category as in (B). (D) Voltage responses to current steps with hair bundles perfused with 0.02 mM Ca2+ for three gerbil cochlear locations with different CFs. τm obtained from fits (dashed lines) and CF were: 0.67 ms (0.35 kHz); 0.23 ms (0.9 kHz); 0.10 ms (2.5 kHz).

