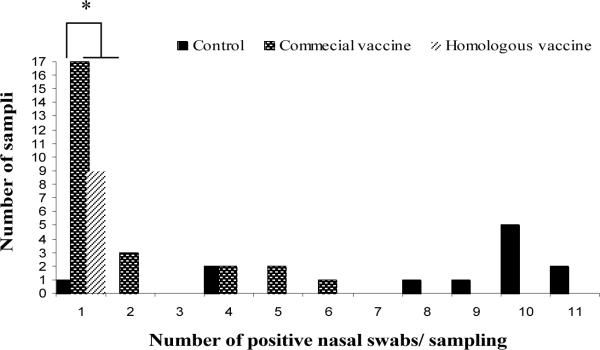
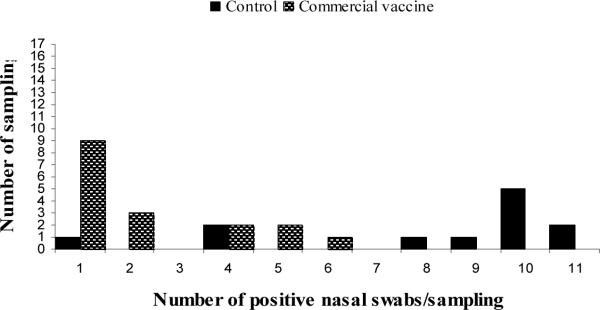
Figure 1.
Number of positive nasal swabs per pen collection by group of treatment. Figure 1.A includes results from the seeder and contact pigs. Figure 1.B includes results only from the contact infected pigs by group of treatment.
* In vaccinated groups, the frequency of pen collections with only one positive pig within the pen were higher than in the control group (p<0.05).


