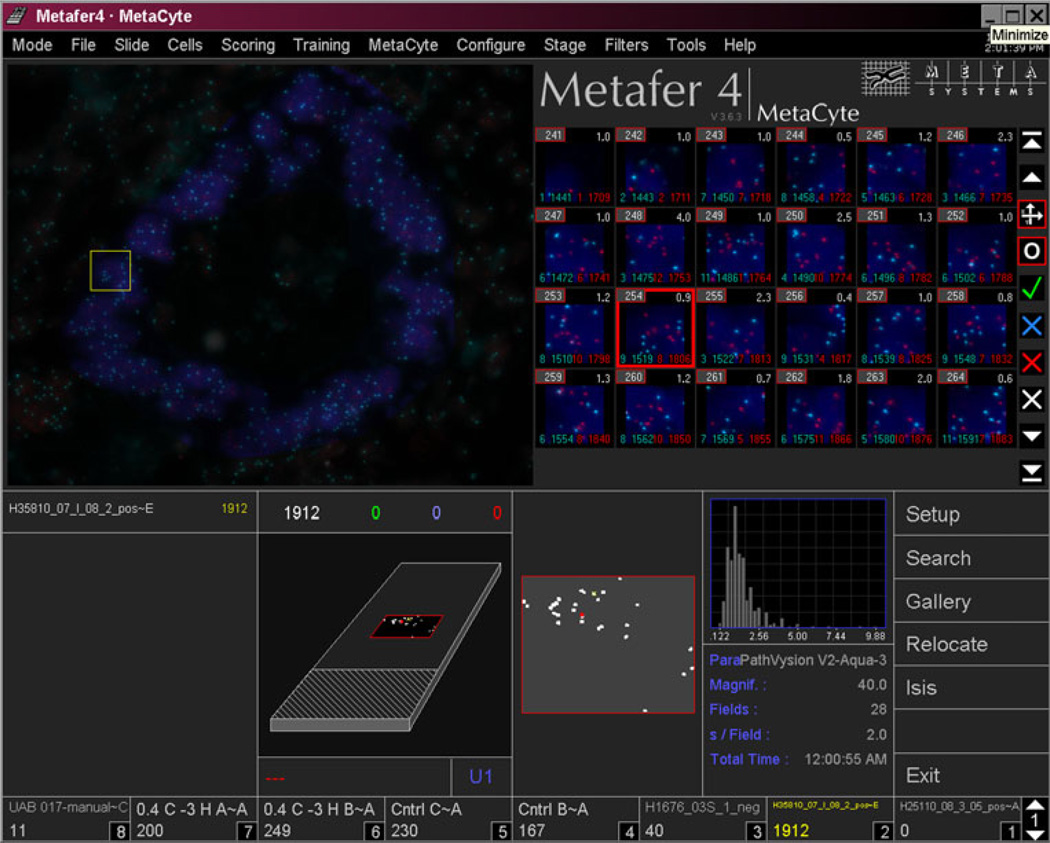
Fig. 3.
Screen capture of image analysis. The gallery (upper right) shows “tile sampling” images generated from Fig. 2b (upper left). The lower part shows relocation data and enumeration histogram. The highlighted gallery image (red box) can be found back in the overview picture (yellow box)

