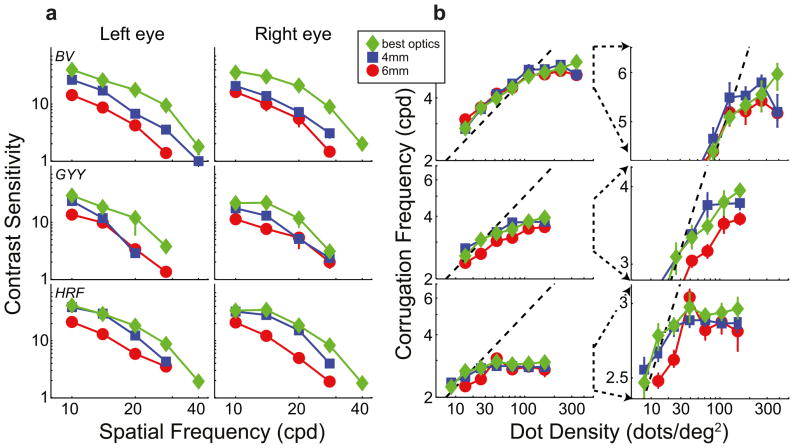
Figure 2.
Contrast sensitivity and stereo resolution for different optical conditions. Each row plots the data from one observer. a) Contrast sensitivity. The left and middle columns show sensitivity for the left and right eyes, respectively. Each panel plots the reciprocal of contrast at threshold as a function of spatial frequency. Normal optics: blue squares represent data with 4-mm pupil, white light, and no phase plate; red circles represent data with 6-mm pupil, white light, and no phase plate. Improved optics: green diamonds represent 2.5-mm pupil, monochromatic light with phase plates in place, which provided better-than-normal optics. Error bars are standard errors. b) Results from the stereo resolution experiment with corrugation stimuli. The highest discriminable corrugation frequency is plotted as a function of dot density. The symbol types represent the same optical conditions as in a. The dashed lines represent the frequency of the Nyquist sampling limit. Error bars are standard errors. The left column shows the whole set of data. The right column shows exploded views of the data centered around high dot densities and high corrugation frequencies.

