
Figure 11.
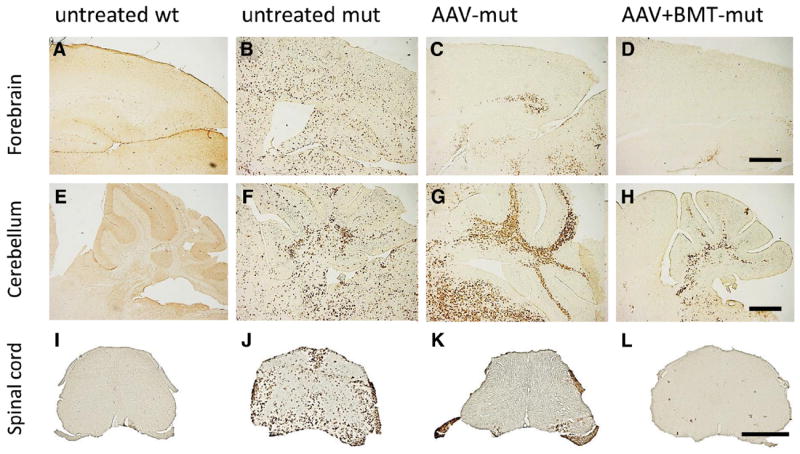
CD68 immunohistochemistry. CD68 staining of the forebrain (A–D), cerebellum (E–H), and the spinal cord (I–L) at 36 d of age show increased staining in the untreated mut group (B, F, J). In the AAV-mut cerebellum (G), the CD68 staining appears similar or increased in intensity to that of the untreated mut (F). Interestingly, there appears to be decreased staining in the spinal cord (K) and the forebrain (C). In the AAV+BMT-mut group, the CD68 staining is decreased in most regions and indistinguishable from untreated wt mice in certain regions. A–H were imaged at the same magnification. Scale bars: D, H, ~600 μm. I–L were imaged at the same magnification. Scale bar: L, ~600 μm.