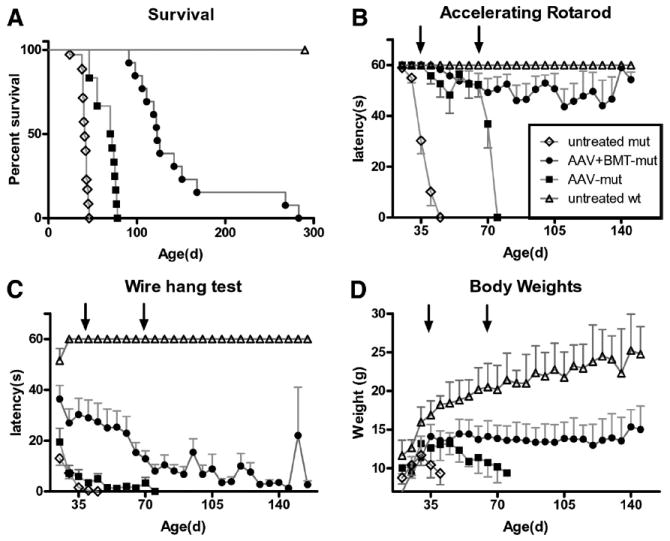
Figure 6.

Survival and behavior. Kaplan–Meier curves showing the survival of various treatment groups (A). The median life span of the AAV-mut group (71 d; range, 46 –78 d) was significantly greater than (p < 0.001) that of the untreated mut group (41 d; range, 24 – 46 d). The median life span of the AAV+BMT-mut group (123 d; range, 92–282 d) was significantly greater than that of the AAV-mut group (p < 0.001). Behavior was evaluated using constant speed rotarod and wire hang test. Animals in the AAV-mut and AAV+BMT-mut group performed significantly better than the untreated mut group in the accelerating (B) rotarod motor function tests at 35 d and at 70 d of age (arrows). There was a statistically significant improvement in latency on wire hang test only in the AAV+BMT-mut group (C) at day 35 of age. Body weights (D) in the AAV+BMT-mut group were significantly higher compared with the untreated mut at 35 d of age. There was no significant difference between the AAV-mut and untreated mut groups at 35 d of age. At 70 d of age, the body weights were significantly higher in the AAV+BMT-mut group compared with the AAV-mut group. The body weights were maintained in the long-lived animals from the AAV+BMT-mut group. Error bars represent SEM.
