Figure 1.
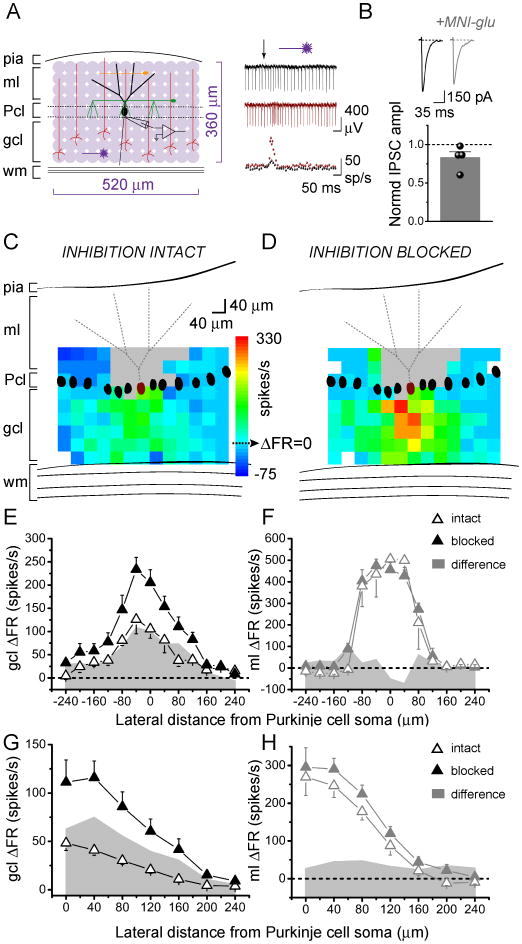
In the sagittal orientation, increases in Purkinje cell output are evoked by granule cells underlying the Purkinje cell.
A, Left, Schematic of cerebellar cortex and sagittal photostimulation mapping paradigm. Extracellular recordings were made from an individual Purkinje cell as glutamate was systematically photoreleased with 40 μm spacing over a 520×360 μm region of the cerebellar slice. ml, molecular layer; Pcl, Purkinje cell layer; gcl, granule cell layer; wm, white matter; black, Purkinje cell; red, granule cell; green, basket cell; orange, stellate cell. Right, top, Sample extracellular recordings from a Purkinje cell with inhibition intact (black) and blocked (burgundy). Glutamate was photoreleased at the time indicated by the arrow. Bottom, Corresponding plots of instantaneous firing rate vs. time.
B, Purkinje cells were whole-cell voltage clamped at -60 mV and IPSCs were recorded in response to electrical stimulation of molecular layer interneurons, in the absence and presence of 250 μM MNI-caged-L-glutamate. CNQX was present throughput the experiment to block excitatory transmission. Top, Sample recordings. Bottom, The average amplitude of evoked IPSCs in the presence of caged glutamate normalized to the average amplitude in the control condition.
C, D, Maximum and minimum instantaneous post-photolysis firing rate responses to glutamate photorelease of a single Purkinje cell (burgundy) were converted to post-photolysis change in firing rate relative to baseline (ΔFR), pseudocolored, and plotted at the corresponding photolysis sites to generate Purkinje cell response maps. The baseline firing rate of the example cell shown was 48 spikes/s with inhibition intact (C), and 52 spikes/s with inhibition blocked (D). Gray areas represent dendritic sites where glutamate photolysis directly targeted the recorded Purkinje cell. White pixels represent sites in which no data was obtained due to stimulation failures or noise.
E, F, Lateral profiles of a single Purkinje cell's responses to glutamate photorelease in the sagittal orientation in the granule cell layer (E) or the molecular layer (F) were generated by averaging the responses along each 40 μm-wide column and plotting the results as a function of lateral distance from the soma of the recorded Purkinje cell. Data is from the Purkinje cell shown in C, D. Open and closed triangles denote responses with inhibition intact and blocked, respectively. Shaded gray area plots show the difference in change in firing rate between the two conditions.
G, H, Compiled vertically-collapsed average profiles of Purkinje cell responses to glutamate photorelease in the sagittal orientation in the granule cell layer (G; control, n=27, picrotoxin n=9) or the molecular layer (H; control, n=8, picrotoxin n=8). The data are folded along the Purkinje cells' vertical axes. The average change in firing rate from baseline is plotted as a function of lateral distance from the soma of the recorded Purkinje cell. Open and closed triangles denote responses with inhibition intact and blocked, respectively. Gray area plots show the difference in change in firing rate between the two conditions.

