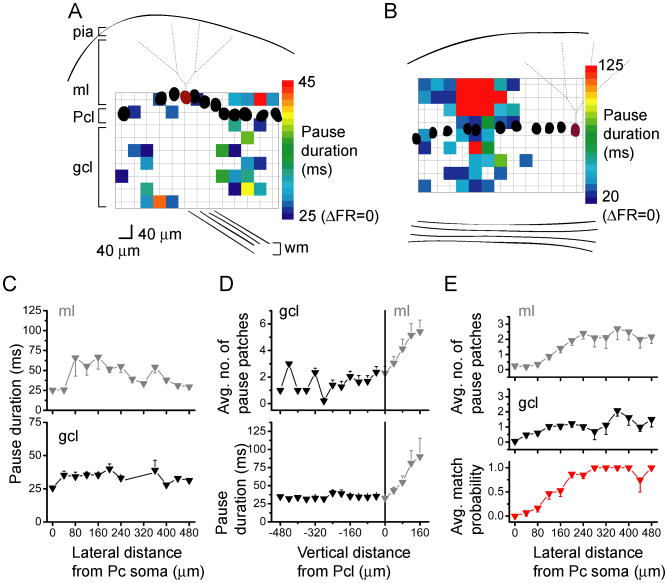
Figure 6.
In the sagittal orientation, decreases in Purkinje cell firing are mainly elicited by laterally-positioned granule cells.
A, B, Sample pseudocolor sagittal Purkinje cell maps of post-photolysis pause duration for two different Purkinje cells (burgundy) with one centered (A) and the second positioned at the edge (B) of the photolysis grid. The lower limits on the color scales indicate the interspike interval corresponding to the spontaneous firing rates of the cells.
C, The average duration of pauses elicited in the recorded Purkinje cell by glutamate photolysis over the granule cell layer (black) and molecular layer (gray), plotted as a function of lateral position relative to the soma of the recorded Purkinje cell. Data were averaged from 20 cells.
D, Same as C, but plotting the number of sites from the same 20 cells that elicited pauses as a function of vertical position relative to the Purkinje cell layer.
E, Top and middle, The average number of post-photolysis pauses as a function of lateral distance from the recorded Purkinje cell, from the same 20 cells. Bottom, For every pause elicited in the granule cell layer, the probability of eliciting a pause from the molecular layer at the same lateral distance from the recorded Purkinje cell was plotted.

