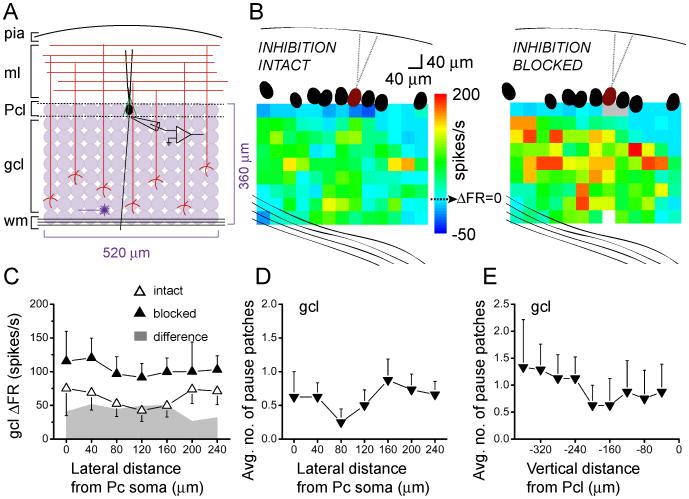
Figure 7.
In the coronal orientation, inhibition strongly, but uniformly, modulates excitation.
A, Schematic of photostimulation mapping paradigm as in Fig. 1A, but in the coronal orientation.
B, Sample pseudocolor coronal maps of change in post-photolysis instantaneous firing rate responses of a Purkinje cell (burgundy). The baseline firing rate of this cell was 31 spikes/s with inhibition intact (left), and 33 spikes/s with inhibition blocked (right).
C, Compiled vertically-collapsed coronal ΔFR profiles of Purkinje cell responses to glutamate photorelease in the granule cell layer. The average change in firing rate from baseline of 5 cells is plotted as a function of lateral distance from the soma of the recorded Purkinje cell. Open and closed triangles denote responses with inhibition intact and blocked, respectively. The superimposed plot in gray shows the difference in change in firing rate between the two conditions.
D, Average number of sites from 8 cells that elicited decreases in Purkinje cell firing rates, plotted as a function of lateral distance from the soma of the recorded Purkinje cell.
E, Average number of sites from the same 8 cells as in D that elicited decreases in Purkinje cell firing rates, plotted as a function of vertical distance from the soma of the recorded Purkinje cell.

