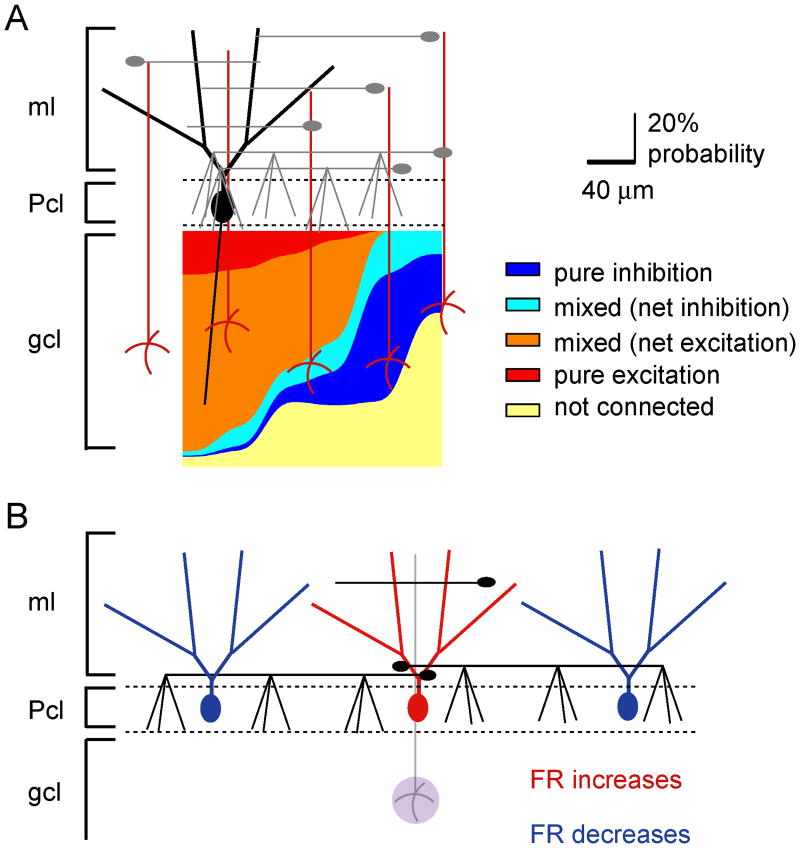
Figure 8.
Summary schematics illustrating the functional organization of Purkinje cell responses.
A, An idealized pseudocolor map of an individual Purkinje cell's activation pattern was constructed based on the compiled probability data. The number of patches of a certain response type at a given lateral distance from the target Purkinje cells was divided by the total number of responses recorded at that distance. The data are plotted as stacked and smoothed area plots denoting the percent probability of each of the five response types as a function of lateral position from the target Purkinje cell.
B, The data suggest that excitation of the same set of granule cells underlying a given Purkinje cell increases that Purkinje cell's firing rate, but decreases the firing rate of another Purkinje cell located along the same sagittal plane.

