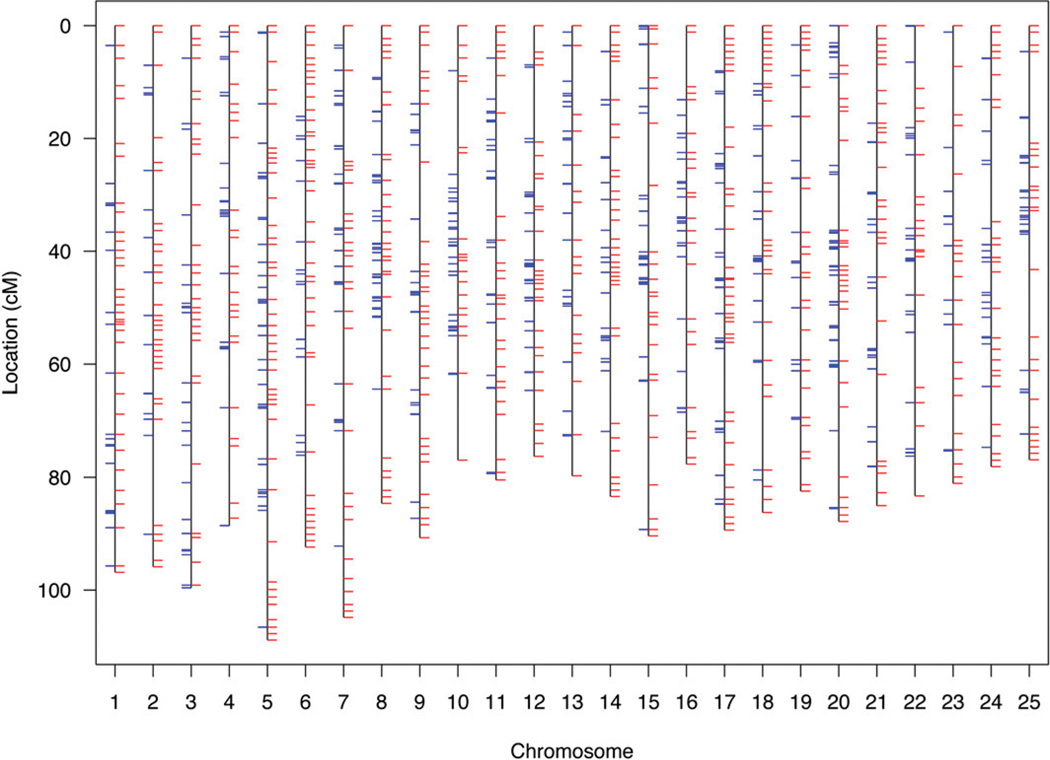
Figure 1.
Unified SNP and STR genetic map of the zebrafish. The SNP map is comprised of 870 SNPs at 618 unique loci (blue tick marks) with a mean locus density of 3.4 Kosambi cM and resolution of 0.01 cM. The SNP genotype data were merged with data of 1989 STRs (red tick marks) of the MGH genetic map for creation of a combined map. The merged map is comprised of 1103 unique loci with a mean locus density of 2.0 Kosambi cM. Further detail of map markers and positions is provided in Table S1.

