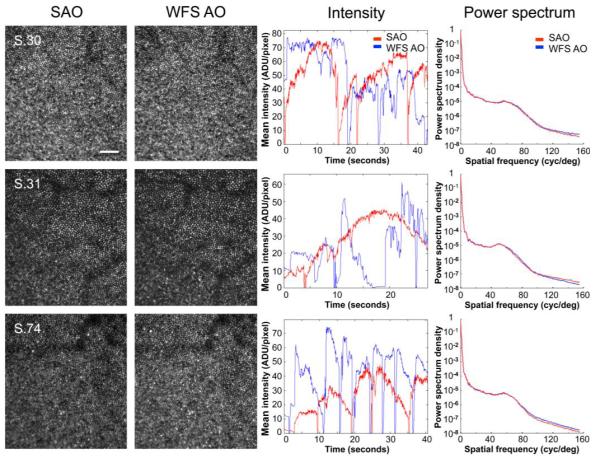
Fig. 5.

Comparison of sensorless and wavefront sensor based control for AOSLO imaging through natural, undilated pupils (S.30, 6 mm; S.31, 4 mm; S.74, 6 mm) in the same 3 representative subjects. Images after sensorless adaptive optics (SAO, 1st column) and wavefront sensor based adaptive optics (WFS AO, 2nd column) were subjectively similar for all subjects. Images were acquired at ~1 deg eccentricity and are shown at the same scale. Scale bar is 10′. The center of the fovea is approximately located in the bottom left corner. Both image intensity (3rd column), and relative spectral power density (4th column) after sensorless control (red) compare favorably with wavefront sensor based control (blue). The irregularity of the mean intensity traces with wavefront sensor based control likely reflects 1. difficulties in obtaining an accurate wavefront sensor based control signal with smaller, fluctuating, pupils, and 2. tear film instabilities or break-up. (The sharp dips in the mean intensity traces are due to blinks or partial blinks.) Note that the PMT gain was adjusted separately for each subject and pupil size, precluding direct comparison of absolute intensity values across subjects or between undilated and dilated pupils. Gain and perturbation amplitudes (Γ, σ) for each subject were as follows: S.30, (60, 0.02); S.31, (50, 0.02); S.74, (60, 0.02).
