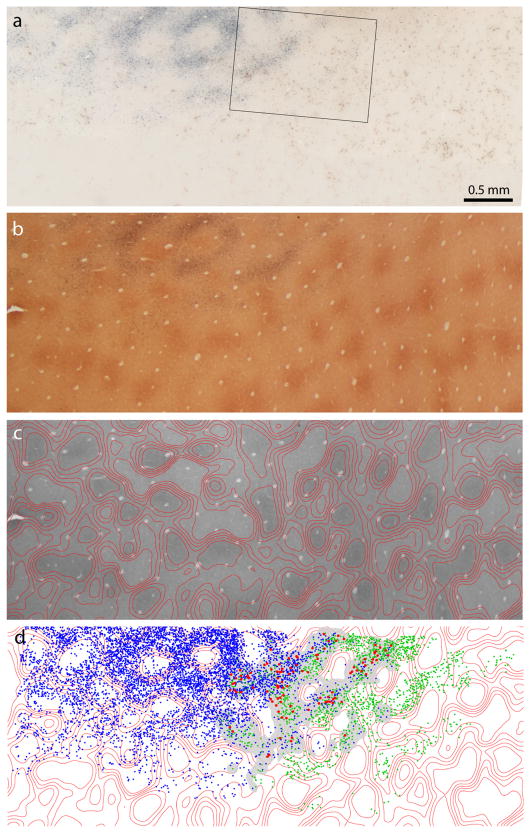
Figure 10.
V1 label after dual tracer injections in V2. a, Bright-field view of the retrograde label from the dual tracer injections in Figure 9. The CTB-Au label shows clearly as a gray reaction product, but the brown WGA-HRP label is difficult to discern. Boxed region is shown at higher magnification in Figure 11 a. b, Adjacent CO section through layer 2/3. c, Density contours superimposed on CO-stained section in b. d, Plot of CTB-Au cells (blue), WGA-HRP cells (green), and double-labeled cells (red). The gray mask denotes the overlap zone in which double-labeled cells could potentially occur (see Materials and Methods).

