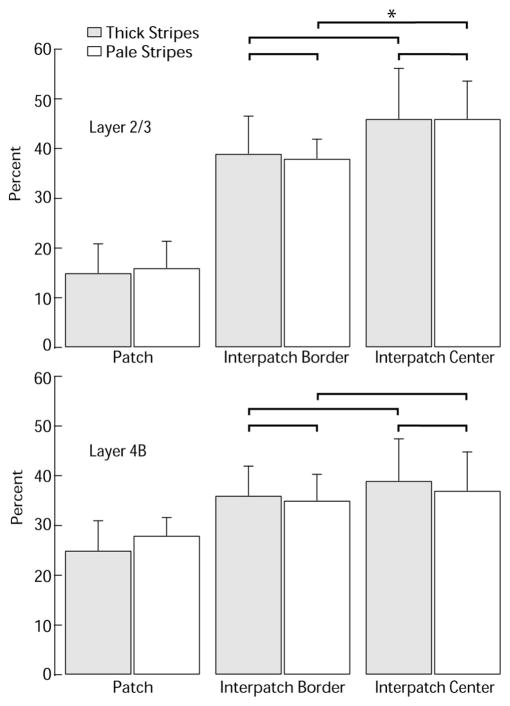
Figure 12.
Histogram showing percentage of cells in patches (zones 1–2) versus interpatches (zones 3– 6) after thick stripe or pale stripe injection. For both stripe classes, the fraction of cells located in interpatches was significantly greater than expected from a random distribution (see Results). In this histogram, we have divided the interpatches into “borders” (zones 3– 4) and “centers” (zones 5– 6). None of the comparisons (brackets) between border and center categories were significant, except for a greater proportion of cells in centers compared with borders in layer 2/3 after pale stripe injection (*p = 0.013, Wilcoxon rank sum test).

