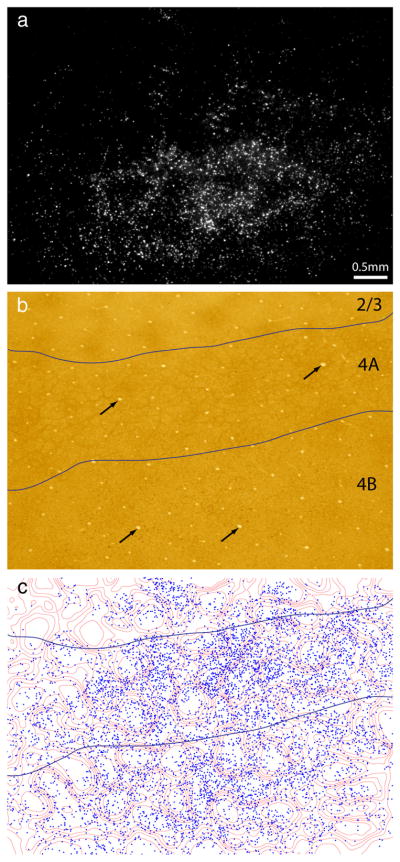
Figure 3.
Thick stripes receive input from interpatches in layer 4B. a, Retrogradely labeled cells in a section passing through layer 4. Their density is greatest in the lower half of the image, which passes through layer 4B. There is a scant population of cells in the upper half of the image, corresponding to layer 4A. The strip of layer 3 at the top of the image contained virtually no cells. Although layer 2/3 had the densest labeling, cells were usually concentrated in more superficial sections. b, Same section, viewed in bright field, with the layers denoted. Layer 4A is defined by the characteristic honeycomb pattern of CO activity. c, Location of 6944 cells in 4B plotted with respect to CO density. The contours were transferred from layer 2/3 (Fig. 2c), using blood vessels (arrows) for alignment. Plots were made from three consecutive sections to derive a complete field of layer 4B cell labeling. Cells in 4B show less avidity for interpatches compared with cells in layer 2/3.

