
Figure 8.
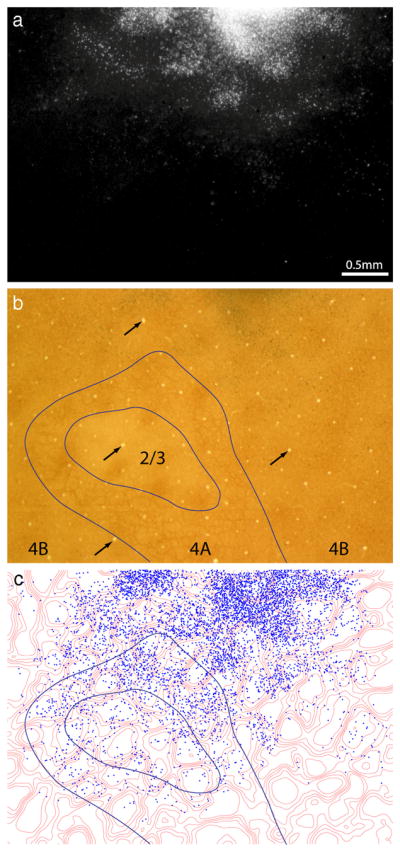
Pale stripes receive input from interpatches in layer 4B. a, Labeled cells in a section passing through layer 4B, from the same region shown in Figure 7. Their density is greatest near the injection site at top. b, Same section in bright field, with the layers denoted. c, Location of cells in 4B plotted with respect to CO density. Cells were plotted in two adjacent 4B sections.