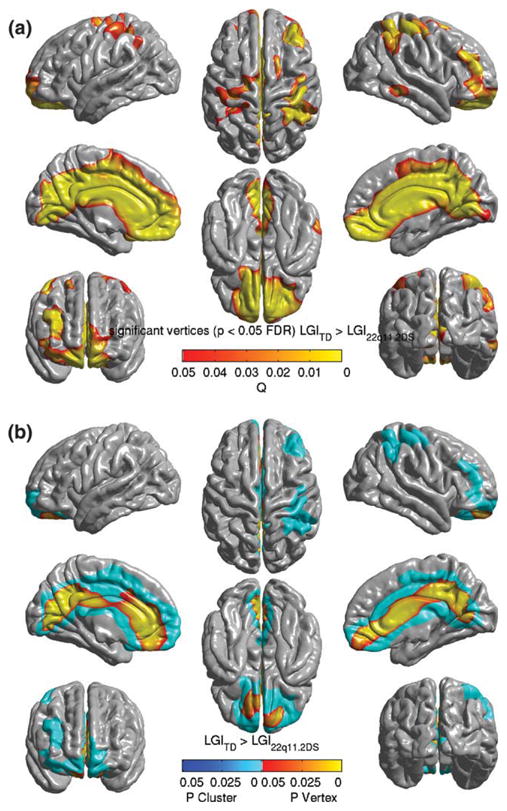
Figure 1.

Significant vertices and clusters where the lGI for TD was significantly greater than those for the 22q11.2DS population, controlling for age and cortical volume, and projected on the average pial surface of the population specific template. (a) Significant vertices explored with FDR-corrected SPM at α = 0. 05. P-values for suprathreshold voxels are color coded according to the hot color map. The image shows large bilateral areas of lGI decrease in 22q11.2DS population, involving most of the mid-line structures, and a bilateral ares of deficit involving the superior parietal, inferior parietal, central and superior precentral areas. (b) Only the significant vertices that were in the mid-line regions and right parietal/prefrontal areas were included in significant clusters, after thresholding for both the peak height and extent (t ≥ 4.01, extent ≥ 0.52 resels). The P-values for the significant clusters, the entirety of which get a single P value, have been color coded in shades of blue. The coordinates of peak vertices within the clusters and other descriptive statistics are tabulated in Table I.
