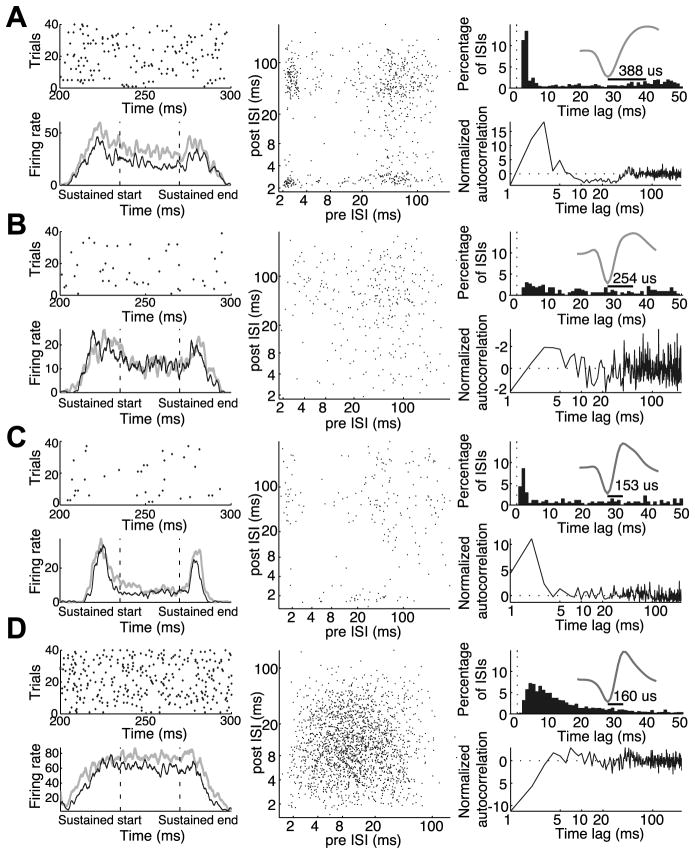
Figure 2.
Examples of four individual neurons with varying degrees of burstiness. A: Example of a bursty broad spiking neuron. B: Example of non-bursty broad spiking neuron. C: Example of a bursty narrow spiking neuron. D: Example of a non-bursty narrow spiking neuron. For each neuron, top left panels show spike raster plots of a 100ms window within the sustained period for the first 40 correct unattended trials. Bottom left panels show the neuronal response (spikes per second) averaged across trials, to targets (gray) and distracters (black) as they entered the receptive field, paused, and exited the receptive field. These response time courses were smoothed by convolving each with a Gaussian kernel (σ = 25ms). Middle panels show interspike interval return maps for the unattended condition. Each point corresponds to one action potential, plotted to indicate its interspike interval relative to the previous and subsequent spikes. Top right panels show interspike interval histograms (bin width, 4ms). Insets in the top right panels are normalized mean action potential waveforms, with peak to trough duration indicated by horizontal bars. Bottom right panels show the normalized autocorrelation functions (autocorrelation minus the shuffle predictor divided by the standard deviation of the shuffle predictor; see Methods) for the unattended condition. Dashed line at 0 indicates the normalized autocorrelation function of a rate-matched Poisson process.

